No specialty in medicine manages cardiac and pulmonary physiology as directly on a daily basis as anesthesiology. (1-3) An understanding of cardiorespiratory physiology prepares the anesthesia team to manage critical and common situations in anesthesia, including hypotension, arterial hypoxemia, hypercapnia, and high peak airway pressures.
1. HEMODYNAMICS
Systemic arterial blood pressure and mean arterial pressure (MAP) are commonly monitored by anesthesia providers via a blood pressure cuff or an indwelling arterial cannula. Although treatment of chronic systemic hypertension is sometimes necessary, acute hypotension is often a problem with many anesthetics. Hypotension varies from mild clinically insignificant reductions in MAP from general anesthesia or regional anesthesia to life-threatening emergencies. Hypotension can be of sufficient magnitude to jeopardize organ perfusion, causing injury and an adverse outcome. Organs of most immediate concern are the heart and brain, followed by the kidneys, liver, and lungs. All have typical injury patterns associated with prolonged “shock.” Understanding the physiology behind hypotension is critical for diagnosis and treatment.
Intraoperative hemodynamic instability has long been thought to result in worse outcomes after surgery. In recent large retrospective studies, intraoperative hypotension of even 5 minutes’ duration (systolic blood pressure [SBP] < 70 mm Hg, MAP < 50 mm Hg, diastolic blood pressure [DBP] < 30 mm Hg) is associated with increased postoperative morbidity and mortality risks. (4,5) In addition, the combination of hypotension, small volatile anesthetic concentrations, and low bispectral index scale (BIS) values have been associated with worse postoperative outcomes. Whether a change in anesthetic management will alter these risks needs future study. (6)
Physiologic Approach to Hypotension The logical treatment of acute hypotension categorizes MAP into its physiologic components:
MAP = SVR × CO
where SVR is the systemic vascular resistance and CO is cardiac output. Although most of our focus is on understanding MAP alone, the other pressures (e.g., SBP, DBP, and pulse pressure [PP = SBP – DBP]) also require attention. The pulse pressure is created by the addition of stroke volume (SV) on top of the DBP within the compliant vascular tree. The aorta is responsible for most of this compliance. Increased pulse pressure can occur with an increased SV but most often occurs because of the poor aortic compliance that accompanies aging. Decreasing DBP can have more dramatic effects on SBP when vascular compliance is poor.
Systemic Vascular Resistance
Most drugs administered during general anesthesia and neuraxial regional anesthesia decrease SVR. Several pathologic conditions can produce profound reductions in SVR, including sepsis, anaphylaxis, spinal shock, and reperfusion of ischemic organs. The calculation for SVR follows:
SVR = 80×(MAP− CVP)/CO
where CVP is the central venous pressure, and the factor 80 converts units into dyne/s/cm5 from pressure in millimeters of mercury (mm Hg) and CO given in liters per minute (L/min).
Pulmonary artery (PA) catheterization can be used to obtain the measurements necessary for calculating SVR, but this monitor is not usually immediately available. Signs of adequate perfusion (e.g., warm extremities, good pulse oximeter plethysmograph waveform, and perfusion index*) may sometimes be present when hypotension is caused by low SVR. On the other hand, hypertension nearly always involves excessive vasoconstriction.
Resistance is inversely proportional to the fourth power of the radius. Individually, small vessels offer a very high resistance to flow. However, total SVR is decreased when there are many vessels arranged in parallel. Capillaries, despite being the smallest blood vessels, are not responsible for most of the SVR because there are so many in parallel. Most of the resistance to blood flow in the arterial side of the circulation is in the arterioles.
Cardiac Output
As a cause of hypotension, decreased CO may be more difficult to treat than decreased SVR. Increased CO is not usually associated with systemic hypertension, and most hyperdynamic states, such as sepsis and liver failure, are associated with decreased systemic blood pressure.
CO is defined as the amount of blood (in liters) pumped by the heart in 1 minute. Although the amount of blood pumped by the right side and left side of the heart can differ in the presence of certain congenital heart malformations, these amounts are usually the same. CO is the product of heart rate (HR) and SV, the net amount of blood ejected by the heart in one cycle:
CO = HR × SV
CO can be measured clinically by thermodilution via a PA catheter and by transesophageal echocardiography (TEE). Less invasive devices to measure CO have been developed, including esophageal Doppler and pulse contour analysis. Because the normal CO changes according to body size, cardiac index (CO divided by body surface area) often is used.
Heart Rate
Tachycardia and bradycardia can cause hypotension if CO is decreased. The electrocardiogram (ECG), pulse oximetry, or physical examination can identify the presence of bradycardia or tachycardia. The identification of a P wave on the ECG is essential for analyzing HR. Loss of sinus rhythm and atrial contraction results in decreased ventricular filling. Atrial contraction constitutes a significant percentage of preload, even more so in patients with a poorly compliant ventricle. A slow HR may result in enhanced ventricular filling and an increased SV, but an excessively slow HR results in an inadequate CO. Tachycardia may result in insufficient time for the left ventricle to fill and result in low CO and hypotension.
Ejection Fraction and Stroke Volume
Ejection fraction (EF) is the percentage of ventricular blood volume that is pumped by the heart in a single contraction (SV/end-diastolic volume [EDV]). Unlike SV, the EF does not differ on the basis of body size, and an EF of 60% to 70% is considered normal. Hyperdynamic states such as sepsis and cirrhosis are reflected by an increased EF. Poor cardiac function is indicated by a small EF. Because CO can be maintained by increasing HR, the SV should be calculated to better assess cardiac function. However, with chronic dilated cardiomyopathy, the SV can improve despite the smaller EF.
Preload
Preload refers to the amount the cardiac muscle is “stretched” before contraction. Preload is best defined clinically as the EDV of the heart, which can be measured directly with TEE. Filling pressures (e.g., left atrial [LA] pressure, pulmonary capillary wedge pressure [PCWP], pulmonary artery diastolic [PAD] pressure) can also assess preload. CVP measures filling pressures on the right side of the heart, which correlates with filling pressures on the left side of the heart in the absence of pulmonary disease and when cardiac function is normal. By using a balloon to stop flow in a PA, pressure equilibrates within the system so that PCWP is nearly equivalent to LA pressure and reflects the filling pressure of the left side of the heart. The relationship between pressure and volume of the heart in diastole is depicted by ventricular compliance curves (Fig. 1). With a poorly compliant heart, normal filling pressures may not produce an adequate EDV. Likewise, trying to fill a “stiff” left ventricle to a normal volume may increase intracardiac and pulmonary capillary pressures excessively.
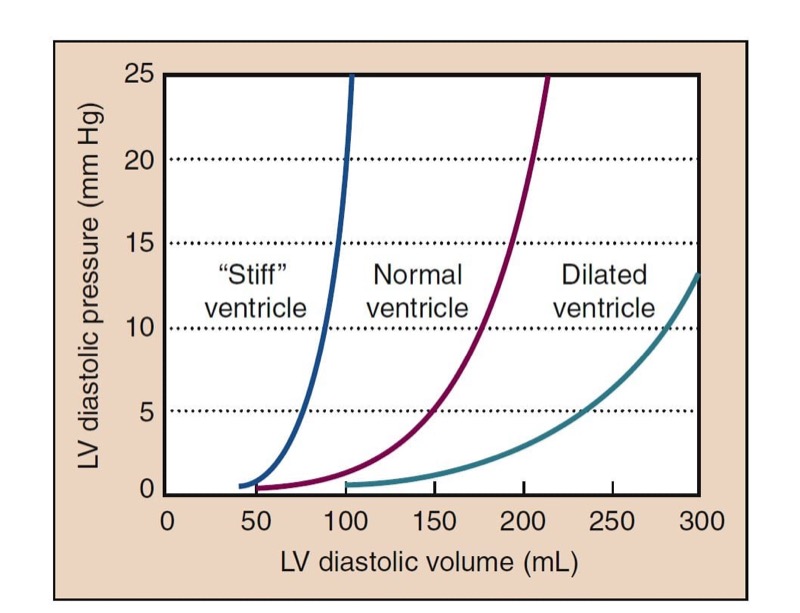
- Fig. 1 The pressure-volume relationship of the heart in diastole is shown in the compliance curves plotting left ventricular (LV) diastolic volume versus pressure. The “stiff” heart shows a steeper rise of pressure with increased volume than the normal heart. The dilated ventricle shows a much more compliant curve.
Frank-Starling Mechanism
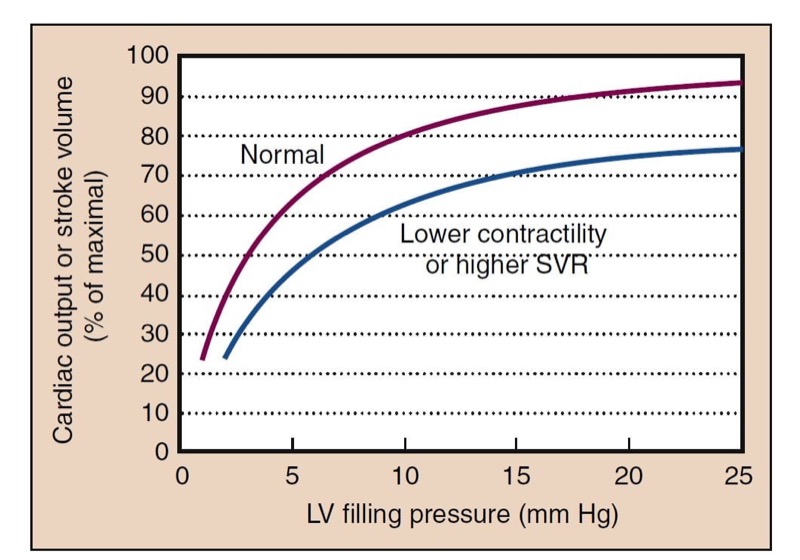
The Frank-Starling mechanism is a physiologic description of the increased pumping action of the heart with increased filling. A larger preload results in increased contraction necessary to eject the added ventricular volume, resulting in a larger SV and similar EF. Reduced ventricular filling, as in hypovolemia, results in reduced SV. Small increases in preload may have dramatic effects (“volume responsiveness”) on SV and CO (Fig. 2). At higher points on the curve, little additional benefit is derived from increases in preload.

- Fig. 2 The cardiac function curve shows the typical relationship between preload, represented by left ventricular (LV) filling pressure, and cardiac function, reflected in cardiac output or stroke volume. Filling pressure can be measured as left atrial pressure or pulmonary capillary wedge pressure. At low preload, augmentation of filling results in significantly increased cardiac output. This is the steeper portion of the curve. At higher LV filling pressures, little improvement in function occurs with increased preload, and with overfilling, a decrement in function can occur because of impaired perfusion (not shown). Lower contractility or higher systemic vascular resistance (SVR) shifts the normal curve to the right and downward.
Causes of Low Preload
Causes of low preload include hypovolemia and venodilation. Hypovolemia may result from hemorrhage or fluid losses. Venodilation occurs with general anesthesia and may be even more prominent in the presence of neuraxial anesthesia. Additional causes of decreased preload include tension pneumothorax and pericardial tamponade, which prevent ventricular filling due to increased pressure around the heart, even though blood volume and filling pressures are adequate. (7) Such conditions may manifest with systolic pressure variation (SPV), which describes changes in SBP with tidal breathing or ventilation that can be observed on an arterial blood pressure tracing. (8) The extreme form of this is pulsus paradoxus, a pulse that changes markedly during tidal breathing. In the setting of normal or increased CVP, the presence of cardiac tamponade may exist. Pulse pressure variation ((PPpeak – PPnadir)/PPaverage) is analogous to SPV but requires computer calculation. Both high SPV and pulse pressure variation (PPV) are also useful in identifying hypovolemia, and are more sensitive and specific indicators of intravascular volume responsiveness than filling pressures.
Pathologic problems on the right side of the heart may prevent filling of the left ventricle. Pulmonary embolism and other causes of pulmonary hypertension prevent the right side of the heart from pumping a sufficient volume to fill the left side of the heart. The interventricular septum may be shifted, further constricting filling of the left side of the heart.
Contractility
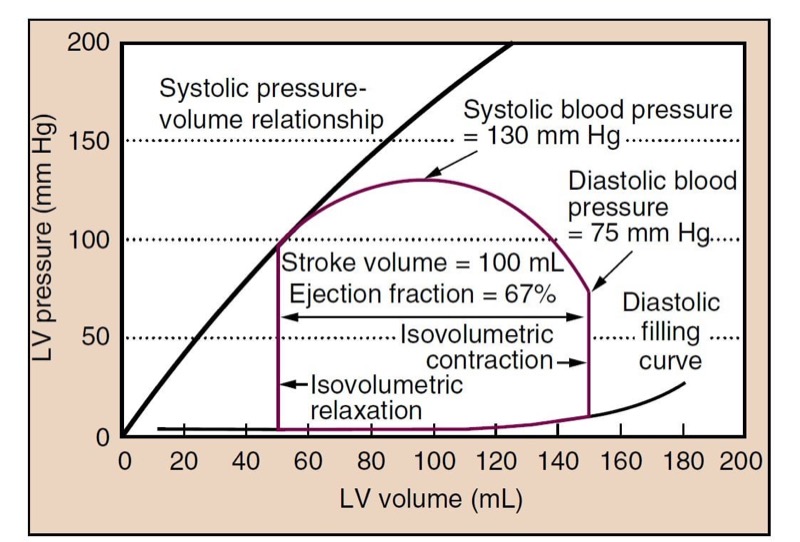
Contractility, or the inotropic state of the heart, is a measure of the force of contraction independent of loading conditions (preload or afterload). It can be measured for research purposes by the rate at which pressure develops in the cardiac ventricles (dP/dT) or by systolic pressurevolume relationships (Fig. 3). Decreased myocardial contractility may be a cause of hypotension.

- Fig. 3 The closed loop (red line) shows a typical cardiac cycle. Diastolic filling occurs along the typical diastolic curve from a volume of 50 mL to an end-diastolic volume (EDV) of 150 mL. Isovolumetric contraction increases the pressure in the left ventricle (LV) until it reaches the pressure in the aorta (at diastolic blood pressure) and the aortic valve opens. The LV then ejects blood, and volume decreases. Pressure in the LV and aorta reaches a peak at some point during ejection (systolic blood pressure), and the pressure then drops until the point at which the aortic valve closes (roughly the dicrotic notch). The LV relaxes, without changing volume (isovolumetric relaxation). When the pressure decreases below left atrial pressure, the mitral valve opens, and diastolic filling begins. The plot shows a normal cycle, and the stroke volume (SV) is 100 mL, ejection fraction (EF) is SV/EDV = 67%, and blood pressure is 130/75 mm Hg. The systolic pressure- volume relationship (black line) can be constructed from a family of curves under different loading conditions (i.e., different preload) and reflects the inotropic state of the heart.
Afterload
Afterload is the resistance to ejection of blood from the left ventricle with each contraction. Clinically, afterload is largely determined by SVR. When SVR is increased, the heart does not empty as completely, resulting in a lower SV, EF, and CO (see Fig. 2). High SVR also increases cardiac filling pressures. Low SVR improves SV and increases CO such that a low SVR is often associated with a higher CO (Fig. 4).

- Fig. 4 Changes in the cardiac cycle that can occur with vasodilatation are depicted. The cycle in green is the same cycle shown in Fig. 3. The red dashed line suggests the transition to the new cardiac cycle shown in blue. The systolic blood pressure has decreased to 105 mm Hg. The end-systolic volume has decreased, as has the end-diastolic volume. End-diastolic pressure (EDP) has decreased from 11 to 7 mm Hg in this example. The ejection fraction is slightly increased; however, the stroke volume may decrease, but with restoration of left ventricular (LV) filling pressures to the same level as before, the stroke volume will be higher.
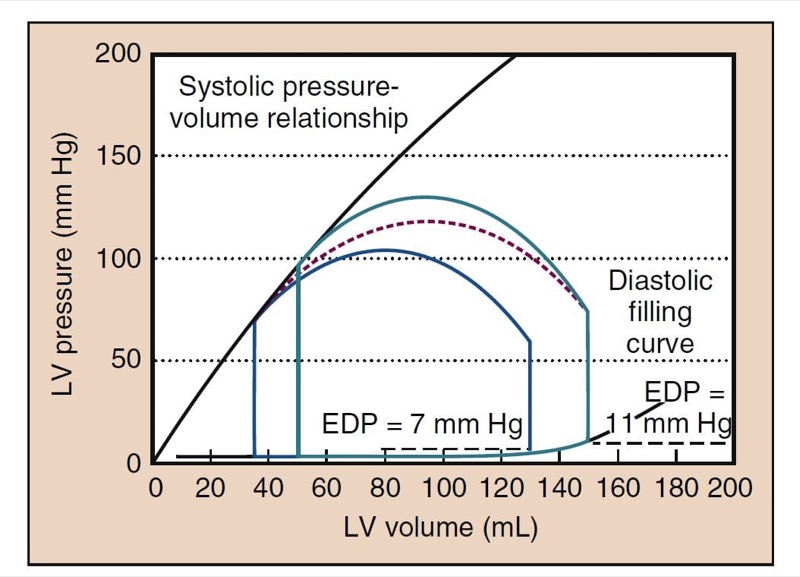
Low SVR decreases cardiac filling pressures. This finding may suggest that preload rather than afterload is the cause of hypotension. Low SVR allows more extensive emptying and a lower end-systolic volume (ESV), one of the hallmarks of low SVR on TEE. With the same venous return, the heart does not fill to the same EDV, resulting in lower left ventricular filling pressures (see Fig. 4). A similar process occurs when the SVR is increased. Such stress-induced increases in cardiac filling pressures are more pronounced in patients with poor cardiac function.
2. CARDIAC REFLEXES
Autonomic Nervous System
The heart and vascular systems are controlled by the autonomic nervous system. Sympathetic and parasympathetic efferents innervate the sinoatrial and atrioventricular nodes. Sympathetic nervous system stimulation increases HR through activation of β1-adrenergic receptors. Parasympathetic nervous system stimulation can profoundly slow HR through stimulation of muscarinic acetylcholine receptors in the sinoatrial and atrioventricular nodes, whereas parasympathetic nervous system suppression contributes to increased HR. Conduction through the atrioventricular node is increased and decreased by sympathetic and parasympathetic nervous system innervation, respectively. Sympathetic nervous system stimulation increases myocardial contractility. Parasympathetic nervous system stimulation may decrease myocardial contractility slightly, but it has its major effect through decreasing HR.
Baroreceptors
Baroreceptors in the carotid sinus and aortic arch are activated by increased systemic blood pressure that stimulates stretch receptors to send signals through the vagus and glossopharyngeal nerves to the central nervous system. The sensitivity of baroreceptors to systemic blood pressure changes varies and is significantly altered by longstanding essential hypertension. A typical response to acute hypertension is increased parasympathetic nervous system stimulation that decreases HR. Vagal stimulation and decreases in sympathetic nervous system activity also decrease myocardial contractility and cause reflex vasodilatation. This carotid sinus reflex can be used therapeutically to produce vagal stimulation that may be an effective treatment for supraventricular tachycardia.
The atria and ventricles are innervated by a variety of sympathetic and parasympathetic receptor systems. Atrial stretch (i.e., Bainbridge reflex) can increase HR, which may help match CO to venous return.
Stimulation of the chemoreceptors in the carotid sinus has respiratory and cardiovascular effects. Arterial hypoxemia results in sympathetic nervous system stimulation, although more profound and prolonged arterial hypoxemia can result in bradycardia, possibly through central mechanisms. A variety of other reflexes include bradycardia with ocular pressure (i.e., oculocardiac reflex) and bradycardia with stretch of abdominal viscera. The Cushing reflex includes bradycardia in response to increased intracranial pressure.
Many anesthetics blunt cardiac reflexes in a dosedependent fashion, with the result that sympathetic nervous system responses to hypotension are reduced. The blunting of such reflexes represents an additional mechanism by which anesthetic drugs contribute to hypotension.
3. CORONARY BLOOD FLOW
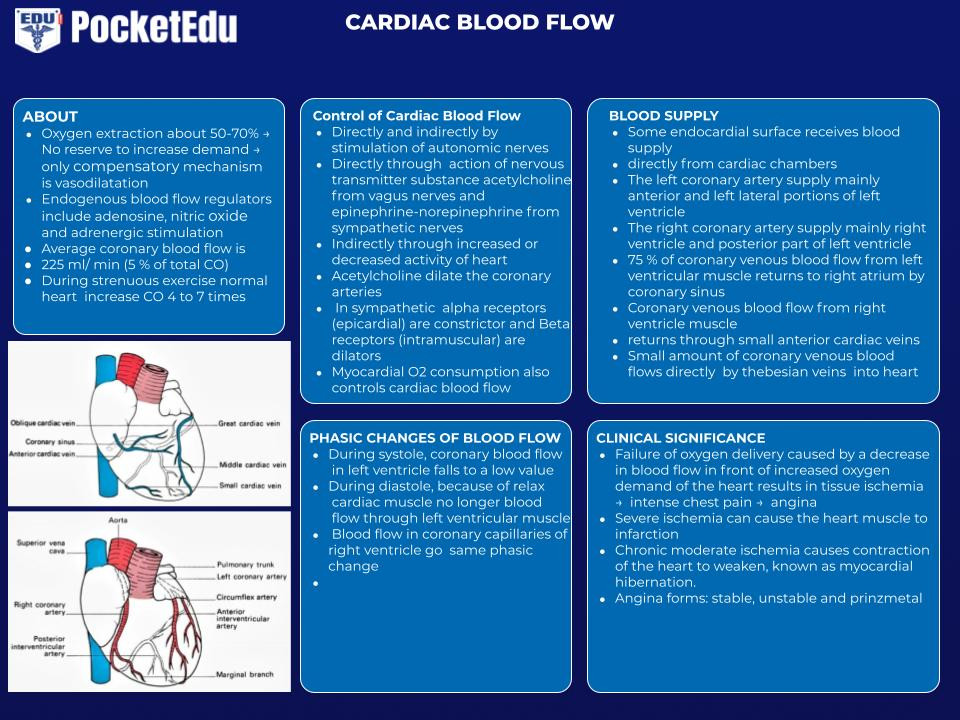
The coronary circulation is unique in that a larger percentage of oxygen is extracted by the heart than in any other vascular bed, up to 60% to 70%, compared with the 25% extraction for the body as a whole. The consequence of this physiology is that the heart cannot increase oxygen extraction as a reserve mechanism. In cases of threatened oxygen supply, vasodilatation to increase blood flow is the primary compensatory mechanism of the heart.
Coronary reserve is the ability of the coronary circulation to increase flow more than the baseline state.
Endogenous regulators of coronary blood flow include adenosine, nitric oxide, and adrenergic stimulation. With coronary artery stenosis, compensatory vasodilatation downstream can maintain coronary blood flow until about 90% stenosis, when coronary reserve begins to become exhausted.
The perfusion pressure of a vascular bed is usually calculated as the difference between MAP and venous pressure. Instantaneous flow through the coronary arteries varies throughout the cardiac cycle, peaking during systole. The heart is fundamentally different from other organs, because the myocardial wall tension developed during systole can completely stop blood flow in the subendocardium. The left ventricle is therefore perfused predominantly during diastole. The end-diastolic pressure in the left ventricle (LVEDP) may exceed CVP and represents the effective downstream pressure. Perfusion pressure to most of the left ventricle is therefore DBP minus LVEDP. The right ventricle, with its lower intramural pressure, is perfused during diastole and systole.
4. PULMONARY CIRCULATION

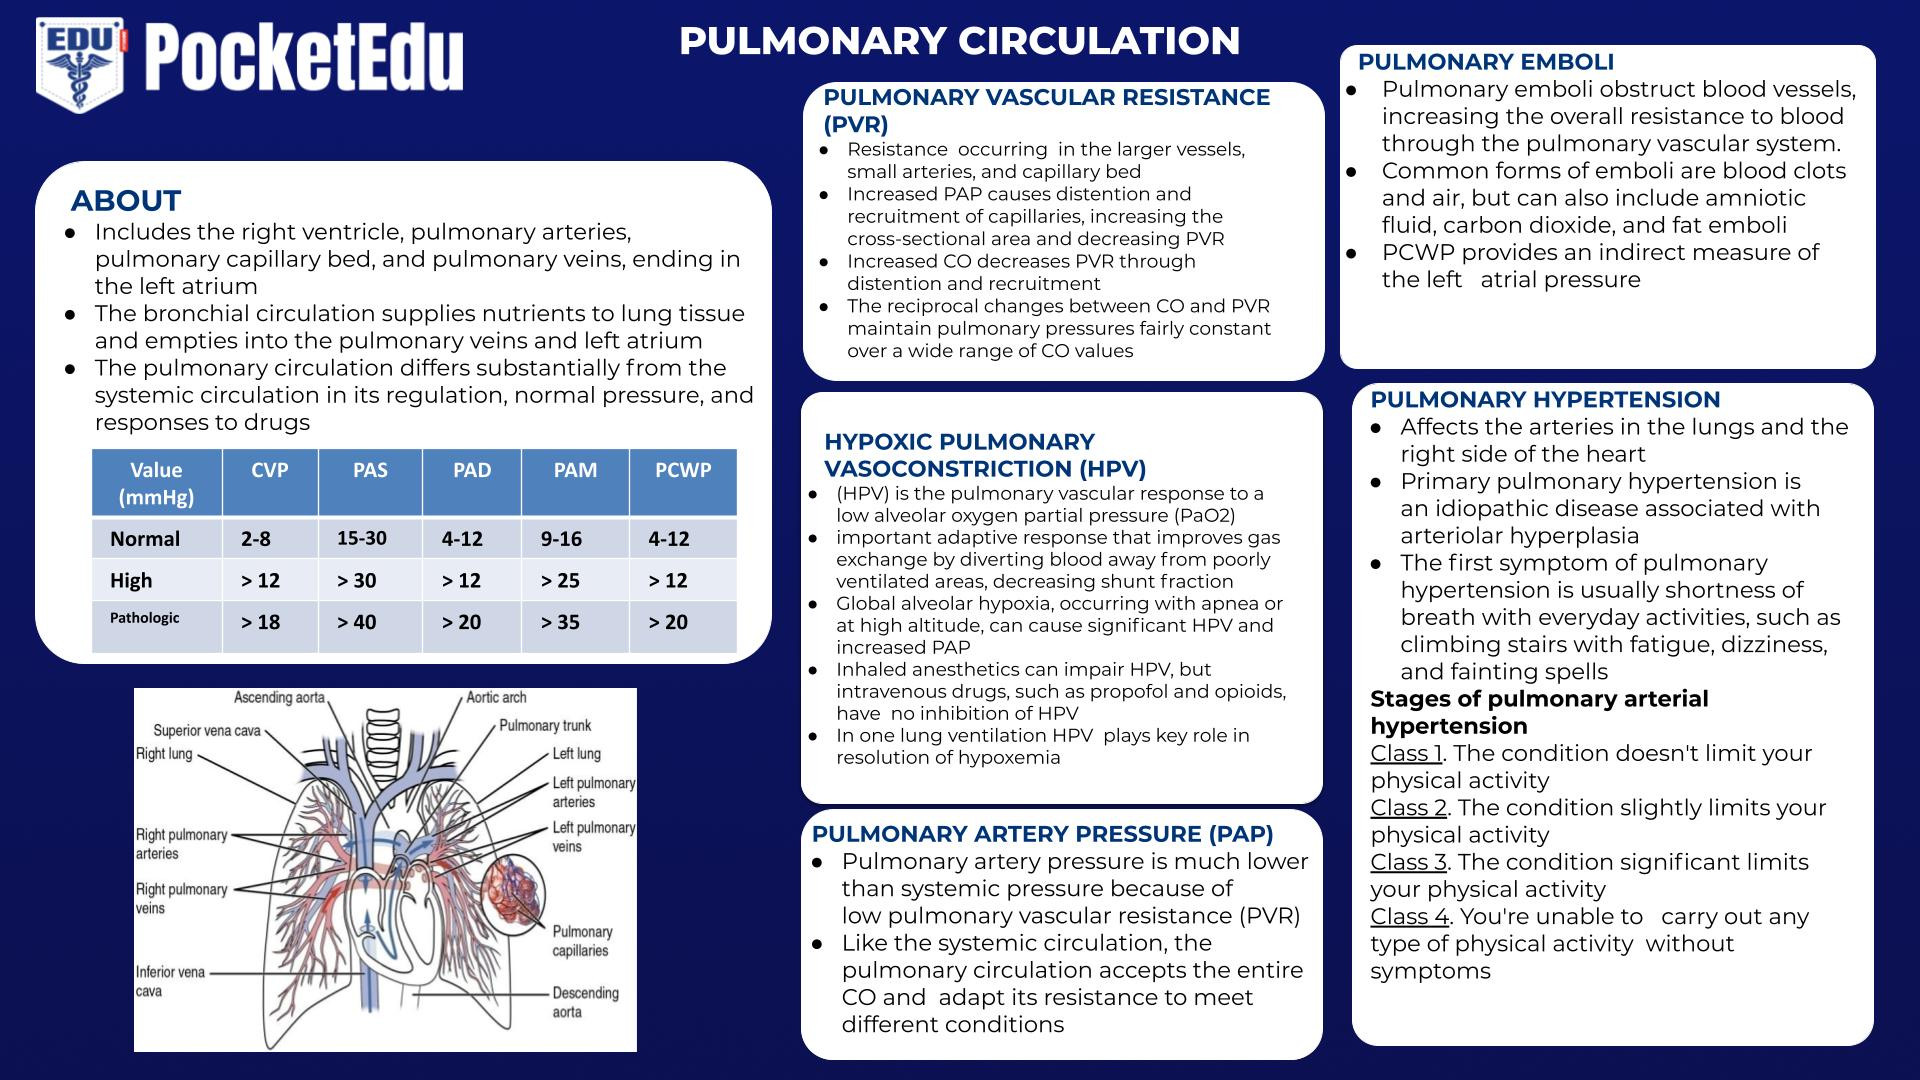
- The pulmonary circulation includes the right ventricle, pulmonary arteries, pulmonary capillary bed, and pulmonary veins, ending in the left atrium. The bronchial circulation supplies nutrients to lung tissue and empties into the pulmonary veins and left atrium. The pulmonary circulation differs substantially from the systemic circulation in its regulation, normal pressures, and responses to drugs. Use of a PA catheter to measure pressures in the pulmonary circulation requires a fundamental understanding of their normal values and their meaning. Pulmonary hypertension has idiopathic causes and may accompany several common diseases (e.g., cirrhosis of the liver, sleep apnea). It is associated with significant anesthetic-related morbidity and mortality rates.
Pulmonary Artery Pressure
Pulmonary artery pressure (PAP) is much lower than systemic pressure because of low pulmonary vascular resistance (PVR). Like the systemic circulation, the pulmonary circulation accepts the entire CO and must adapt its resistance to meet different conditions.
Pulmonary Vascular Resistance
Determinants of PVR are different from SVR in the systemic circulation. During blood flow through the pulmonary circulation, resistance is thought to occur in the larger vessels, small arteries, and capillary bed. Vessels within the alveoli and the extra-alveolar vessels respond differently to forces within the lung.
The most useful physiologic model for describing changes in the pulmonary circulation is the distention of capillaries and the recruitment of new capillaries. The distention and recruitment of capillaries explain the changes in PVR in a variety of circumstances. Increased PAP causes distention and recruitment of capillaries, increasing the cross-sectional area and decreasing PVR. Increased CO also decreases PVR through distention and recruitment. The reciprocal changes between CO and PVR maintain pulmonary pressures fairly constant over a wide range of CO values.
Lung volumes have different effects on intra-alveolar and extra-alveolar vessels. With large lung volumes, intra-alveolar vessels can be compressed, whereas extra-alveolar vessels have lower resistance. The opposite is true at small lung volumes. Therefore, higher PVR occurs at large and small lung volumes. Increased PVR at small lung volumes helps to divert blood flow from collapsed alveoli, such as during one-lung ventilation.
Sympathetic nervous system stimulation can cause pulmonary vasoconstriction, but the effect is not large, in contrast to the systemic circulation, in which neurohumoral influence is the primary regulator of vascular tone. The pulmonary circulation has therefore been very difficult to treat with drugs. Nitric oxide is an important regulator of vascular tone and can be given by inhalation. Prostaglandins and phosphodiesterase inhibitors (e.g., sildenafil) are pulmonary vasodilators, but the pharmacologic responses that can be achieved in pulmonary hypertension are limited.
Hypoxic Pulmonary Vasoconstriction
Hypoxic pulmonary vasoconstriction (HPV) is the pulmonary vascular response to a low alveolar oxygen partial pressure (Pao(2). In many patients, HPV is an important adaptive response that improves gas exchange by diverting blood away from poorly ventilated areas, decreasing shunt fraction. Normal regions of the lung can easily accommodate the additional blood flow without increasing PAP. Global alveolar hypoxia, such as occurs with apnea or at high altitude, can cause significant HPV and increased PAP.
Anesthetic drugs such as the potent inhaled anesthetics can impair HPV, whereas commonly used intravenous drugs, such as propofol and opioids, demonstrate no inhibition of HPV. During surgical procedures requiring one-lung ventilation, HPV may play a role in the resolution of hypoxemia, although many other factors are also important, including acid-base status, CO, development of atelectasis, and concomitant drug administration. (10)
Pulmonary Emboli
Pulmonary emboli obstruct blood vessels, increasing the overall resistance to blood through the pulmonary vascular system. Common forms of emboli are blood clots and air, but they also include amniotic fluid, carbon dioxide, and fat emboli.
Arteriolar Thickening
Arteriolar thickening occurs in several clinical circumstances. It is associated with certain types of long-standing congenital heart disease. Primary pulmonary hypertension is an idiopathic disease associated with arteriolar hyperplasia. Similar changes are associated with cirrhosis of the liver (i.e., portopulmonary hypertension).
Zones of the Lung
A useful concept in pulmonary hemodynamics is West’s zones of the lung. Gravity determines the way pressures change in the vascular system relative to the measurement at the level of the heart. These differences are small compared with arterial pressures, but for venous pressure and PAP, these differences are clinically significant. Every 20 cm of change in height produces a 15-mm Hg pressure difference. This can create significant positional differences in PAP that affect blood flow in the lung in various positions, such as upright and lateral positions.
In zone 1, airway pressures exceed PAP and pulmonary venous pressures. Zone 1 therefore has no blood flow despite ventilation. Normally, zone 1 does not exist, but with positive-pressure ventilation or low PAP, as may occur under anesthesia or with blood loss, zone 1 may develop. In zone 2, airway pressure is more than pulmonary venous pressure, but it is not more than PAP. In zone 2, flow is proportional to the difference between PAP and airway pressure. In zone 3, PAP and venous pressure exceed airway pressure, and a normal blood flow pattern results (i.e., flow is proportional to the difference between PAP and venous pressure). Position can also be used therapeutically to decrease blood flow to abnormal areas of the lung, such as unilateral pneumonia, and thereby improve gas exchange. Blood flow through the collapsed lung during one-lung ventilation is also reduced by this physiologic effect.
Pulmonary Edema
Intravascular fluid balance in the lung depends on hydrostatic driving forces. Excessive pulmonary capillary pressures cause fluid to leak into the interstitium and then into alveoli. Although the pulmonary lymphatic system is very effective in clearing fluid, it can be overwhelmed. Hydrostatic pulmonary edema is expected with high left ventricular filling pressures. Pulmonary edema occurs as PCWP exceeds 20 mm Hg, although patients may tolerate even higher pressures if these pressures persist chronically. Pulmonary edema can also occur with “capillary leak” from lung injury, such as acid aspiration of gastric contents, sepsis, or blood transfusion.
5. PULMONARY GAS EXCHANGE
Oxygen
Oxygen must pass from the environment to the tissues, where it is consumed during aerobic metabolism. Arterial hypoxemia is defined as a low partial pressure of oxygen in arterial blood (Pao(2). An arbitrary definition of arterial hypoxemia (Pao2 < 60 mm Hg) is commonly used but not necessary. Occasionally, arterial hypoxemia is used to describe a Pao2 that is low relative to what might be expected based on the inspired oxygen concentration (Fio(2). Arterial hypoxemia (which reflects pulmonary gas exchange) is distinguished from hypoxia, a more general term including tissue hypoxia, which also reflects circulatory factors.
Mild and even moderate arterial hypoxemia (e.g., at high altitude) can be well tolerated and is not usually associated with substantial injury or adverse outcomes. Anoxia, a nearly complete lack of oxygen, is potentially fatal and is often associated with permanent neurologic injury, depending on its duration. Arterial hypoxemia is most significant when anoxia is threatened, such as with apnea, and the difference between the two may be less than 1 minute.

PRACTICAL
The gold-standard text in anesthesiology; used by everyone worldwide

BE INSPIRED
BONUS: INFOGRAPHICS
The best-selling practical book
enhanced with Flash Cards for tests
preparation.

UNDERSTAND
Make our own study scripts, insert images, YouTube or own videos, literature and never loose them.
READ OR LISTEN.
Learn according to your study style. Read or listen to the voiced-over material.
Measurements of Oxygenation
Measurements of arterial blood oxygen levels include Pao(2), oxyhemoglobin saturation (Sao(2), and arterial oxygen content (Cao(2). Pao(2) and Sao(2) are related through the oxyhemoglobin dissociation curve (Fig. 5). Understanding the oxyhemoglobin dissociation curve is facilitated by the ability to measure continuous oxyhemoglobin saturation with pulse oximetry (Spo(2) and measurement of Pao(2) with arterial blood gas analysis.

- Fig. 5 The oxyhemoglobin dissociation curve is S-shaped and relates oxygen partial pressure to the oxyhemoglobin saturation. A typical arterial curve is shown in red. The higher Pco(2) and the lower pH of venous blood cause a rightward shift of the curve and facilitate unloading of oxygen in the tissues (blue). Normal adult P50, the Po(2) at which hemoglobin is 50% saturated, is shown (26.8 mm Hg). Normal Pao2 of about 100 mm Hg results in an Sao(2) of about 98%. Normal Pvo(2) is about 40 mm Hg, resulting in a saturation of about 75%.
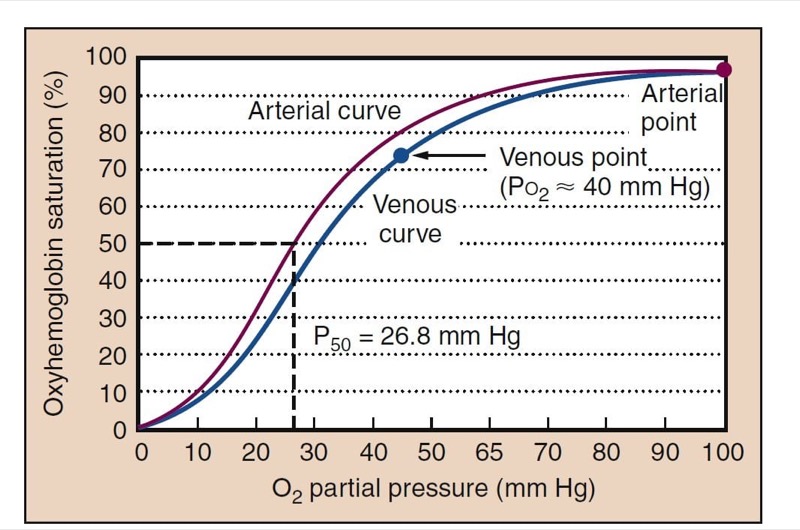
Oxyhemoglobin Dissociation Curve
Rightward and leftward shifts of the oxyhemoglobin dissociation curve provide significant homeostatic adaptations to changing oxygen availability. P50, the Po(2)at which hemoglobin is 50% saturated with oxygen, is a measurement of the position of the oxyhemoglobin dissociation curve (see Fig.5). The normal P50 value of adult hemoglobin is 26.8 mm Hg. Other points on the curve, such as the normal venous point and points for 80% and 90% oxygen saturations may also be clinically useful.
A rightward shift causes little change in conditions for loading oxygen (essentially the same Sao2 at Po2 of 100 mm Hg), but it allows larger amounts of oxygen to dissociate from hemoglobin in the tissues. This improves tissue oxygenation. Carbon dioxide and metabolic acid shift the oxyhemoglobin dissociation curve rightward, whereas alkalosis shifts it leftward. Fetal hemoglobin is left shifted, an adaptation uniquely suited to placental physiology. Oxygen in arterial blood is bound to hemoglobin and dissolved in the plasma. The blood oxygen content is the sum of the two forms. Although amounts of dissolved oxygen are fairly trivial at normal Po2 levels, at high Fio2 dissolved oxygen can be physiologically and clinically important. Although under normal conditions only a fraction (25%) of the oxygen on hemoglobin is used, all of the added dissolved oxygen added while giving supplemental oxygen can be used.
Arterial Oxygen Content
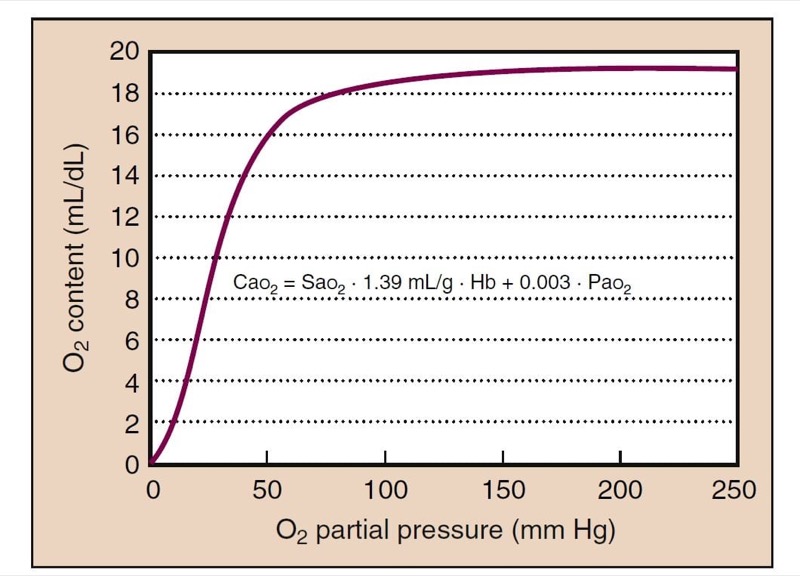
Cao2 is calculated based on Sao(2) and partial pressure plus the hemoglobin concentration (Fig. 6):
CaO2 = SaO2 (Hb × 1.39) + 0.003 (PaO(2)
In the equation, Hb is the hemoglobin level, 1.39 is the capacity of hemoglobin for oxygen (1.39 mL of O2/g of Hb fully saturated), and 0.003 mL O2/dL/mm Hg is the solubility of oxygen. For example, if Hb = 15 g/dL and Pao2 = 100 mm Hg, resulting in nearly 100% saturation, the value of Cao(2) is calculated as follows:
CaO2 = 1.00 (15 × 1.39) + 100 (0.003)
= 20.85 + 0.3
= 21.15 mL/dL
Dissolved oxygen can continue to provide additional Cao(2), which can be clinically significant, with Fio2 of 1.0 and with hyperbaric oxygen. The oxygen cascade depicts the passage of oxygen from the atmosphere to the tissues (Fig. 7).

- Fig. 6 The relationship between Pao(2) and oxygen content is also sigmoidal, because most of the oxygen is bound to hemoglobin. Oxygen content at the plateau of the curve (Po(2) > 100 mm Hg) continues to rise because dissolved oxygen still contributes a small, but not negligible, quantity. Hb, Hemoglobin.

- Fig. 7 The oxygen cascade depicts the physiologic steps as oxygen travels from the atmosphere to the tissues. Oxygen starts at 21% in the atmosphere and is initially diluted with water vapor to about 150 mm Hg, Pio(2). Alveolar Po(2) (Pao2) is determined by the alveolar gas equation. Diffusion equilibrates Po(2) between the alveolus and the capillary. The A-a (alveolar-to-arterial) gradient occurs with intrapulmonary shunt and ventilation to perfusion (V˙ /Q˙ ) mismatch. Oxygen consumption then reduces Po(2) to tissue levels (about 40 mm Hg).

Multiwavelength Pulse Oximetry
Complete measurement of oxygen parameters are derived not just from analysis of arterial blood gases (Pao2) but also from multiwavelength pulse oximetry. Oximetry provides measurement of methemoglobin (MetHb) and carboxyhemoglobin (COHb). Most blood gas machines are now combined with oximeters so that the Sao(2) provided is a true measured value, not calculated. This is called the functional saturation, which is the percent oxyhemoglobin saturation relative to hemoglobin available to bind oxygen. The fractional saturation is relative to all hemoglobin. Therefore, fractional saturation is the functional saturation minus MetHb and COHb. Newer pulse oximeters can now also measure MetHb and COHb.
Determinants of Alveolar Oxygen Partial Pressure The alveolar gas equation describes transfer of oxygen from the environment into the alveoli:
PAO2 = FIO2 × (PB − PH2O) − PCO2/RQ
where Pb is the barometric pressure, Ph2o is the vapor pressure of water (47 mm Hg at normal body temperature of 37° C), and RQ is the respiratory quotient (the ratio of carbon dioxide production to oxygen consumption). For example, while breathing 100% oxygen (Fio(2) = 1.0) at sea level (Pb = 760 mm Hg) and the Ph(2)o = 47 mm Hg with Paco(2) = 40 mm Hg, the alveolar Po(2) (Pao(2)) is calculated as follows. RQ is usually assumed to be approximately 0.8 on a normal diet.
PAO2 = 1.0 (760 − 47) − 40/0.8
= 713 − 50
= 663 mm Hg
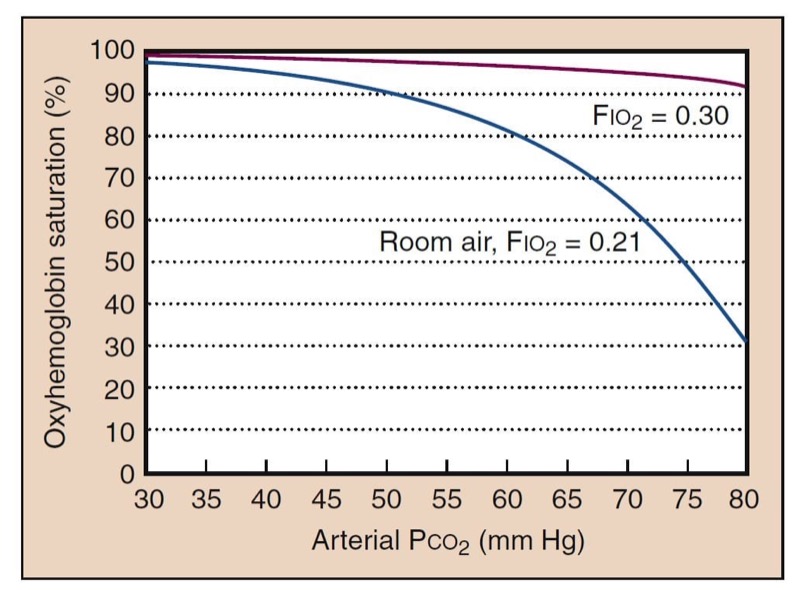
The alveolar gas equation describes the way in which inspired oxygen and ventilation determine Pao(2). It also describes the way in which supplemental oxygen improves oxygenation. One clinical consequence of this relationship is that supplemental oxygen can easily compensate for the adverse effects of hypoventilation (Fig. 8).

- Fig. 8 Hypoventilation decreases oxygenation, as determined by the alveolar gas equation. The blue curve shows what is expected for room air (Fio(2) = 0.21). High Paco(2) further shifts the oxyhemoglobin dissociation curve to the right. However, as little as 30% oxygen can completely negate the effects of hypoventilation (red curve).
Low barometric pressure is a cause of arterial hypoxemia at high altitude. Modern anesthesia machines have safety mechanisms to prevent delivery of hypoxic gas mixtures. Nevertheless, death from delivery of gases other than oxygen is still occasionally reported because of errors in pipe connections made during construction or remodeling of operating rooms. Current anesthesia machines have multiple safety features to prevent delivery of hypoxic gas mixtures. Delivery of an inadequate Fio(2) may occur when oxygen tanks run out or with failure to recognize accidental disconnection of a self-inflating bag (Ambu) from its oxygen source.
Apnea is an important cause of arterial hypoxemia, and storage of oxygen in the lung is of prime importance in delaying the appearance of arterial hypoxemia in humans. Storage of oxygen on hemoglobin is secondary, because use of this oxygen requires significant oxyhemoglobin desaturation. In contrast to voluntary breathholding, apnea during anesthesia or sedation occurs at functional residual capacity (FRC). This substantially reduces the time to oxyhemoglobin desaturation compared with a breath-hold at total lung capacity. The time can be estimated for Sao(2) to reach 90% when the FRC is 2.5 L and the Pao2 is 100 mm Hg. Normal oxygen consumption is about 300 mL/min, although this is somewhat lower during anesthesia. It would take only about 30 seconds under these room air conditions to develop arterial hypoxemia. After breathing 100% oxygen, it might take 7 minutes to reach an Sao(2) of 90%. In reality, the time it takes to develop arterial hypoxemia after breathing 100% oxygen varies. Desaturation begins when sufficient numbers of alveoli have collapsed and intrapulmonary shunt develops, not simply when oxygen stores have become exhausted. In particular, obese patients develop arterial hypoxemia with apnea substantially faster than lean patients.
Venous Admixture
Venous admixture describes physiologic causes of arterial hypoxemia for which Pao(2) is normal. The alveolar-toarterial oxygen (A-a) gradient reflects venous admixture. Normal A-a gradients are 5 to 10 mm Hg, but they increase with age. For example, if the arterial Po(2) while breathing 100% oxygen were measured as 310 mm Hg, the A-a gradient can be calculated from the previous example.
A-a gradient = PAO(2) − PaO(2)
= 663 mm Hg − 310 mm Hg
= 353 mm Hg
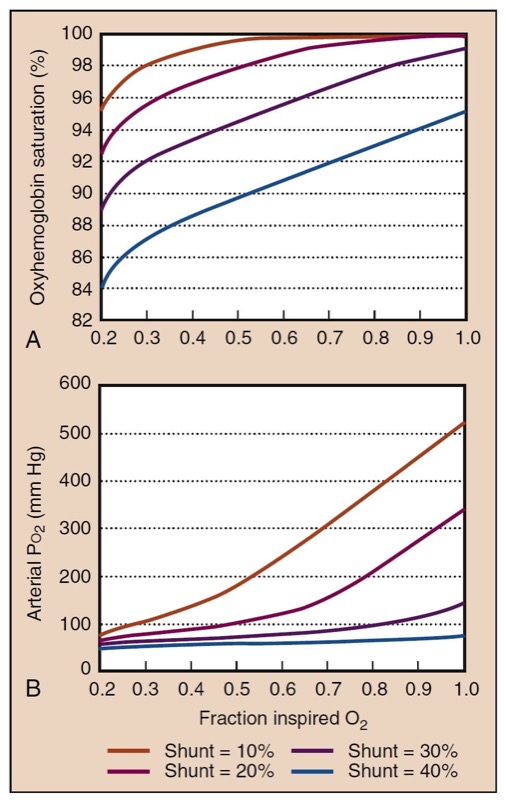
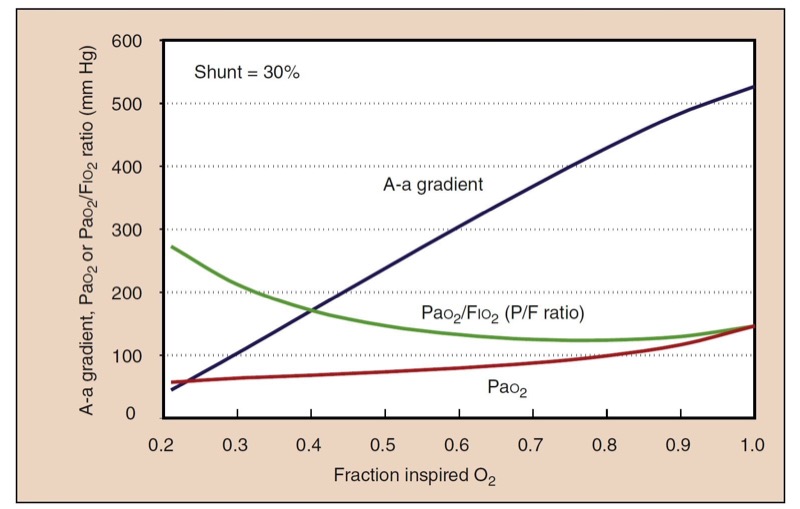
A picture of gas exchange can be accomplished mathematically by integrating all the effects of shunting, supplemental oxygen, and the oxyhemoglobin dissociation curve to create “isoshunt” diagrams (Fig. 9). Although calculating a shunt fraction may be the most exact way to quantitate problems in oxygenation, it requires information only available from a PA catheter and therefore is not always clinically useful. A-a gradients are clinically simpler and more useful to derive but do not represent a constant measurement of oxygenation with different Fio(2) levels. A-a gradient is probably most useful in room air. The P/F ratio (Pao(2)/Fio(2)) is a simple and useful measurement of oxygenation that remains more consistent at high Fio2 (Fig.10).(11)

- Fig. 9 The effect of intrapulmonary shunting and Fio(2) on Pao(2) (A) and Sao2 (B) is shown graphically at shunt fractions from 10% (mild) to 40% (severe). Assumed values for these calculations are hemoglobin, 14 g/dL; Paco(2), 40 mm Hg; arterial-to-venous oxygen content difference, 4 mL O2/dL; and sea level atmospheric pressure, 760 mm Hg. Increased Fio2 still substantially improves oxygenation at high shunt fractions but is unable to fully correct it.

- Fig. 10 Despite a constant shunt fraction of 0.3 (30%), the A-a gradient is much higher at high Fio2, indicating problems in its usefulness as a measurement of oxygenation with different Fio2 values. The ratio of Pao2 to Fio2 (the P/F ratio) is remarkably constant at high Fio2, making it a useful measurement of oxygenation when the gold standard, shunt fraction, is not available.
Intrapulmonary Shunt
Intrapulmonary shunt is one of the most important causes of an increased A-a gradient and the development of arterial hypoxemia. In the presence of an intrapulmonary shunt, mixed venous blood is not exposed to alveolar gas, and it continues through the lungs to mix with oxygenated blood from normal areas of the lung. This mixing lowers the Pao(2). Clinically, shunting occurs when alveoli are not ventilated, as with atelectasis, or when alveoli are filled with fluid, as with pneumonia or pulmonary edema. The quantitative effect of an intrapulmonary shunt is described by the shunt equation:
Q˙ s/Q˙ t=(Cc′o2 −Cao2)/(Cc′o2 −Cvo2)
In the equation, Q˙ s/Q˙ t is the shunt flow relative to total flow (i.e., shunt fraction), C is the oxygen content, c′ is end-capillary blood (for a theoretical normal alveolus), a is arterial blood, and v is mixed venous blood.
Ventilation-Perfusion Mismatch Ventilation-perfusion ( V˙ /Q˙) mismatch is similar to intrapulmonary shunt ( V˙ /Q˙ =0 ) , with some important distinctions. In V˙ /Q˙ mismatch, disparity between the amount of ventilation and perfusion in various alveoli leads to areas of high V˙ /Q˙ (i.e., well-ventilated alveoli) and areas of low V˙ /Q˙ (i.e., poorly ventilated alveoli). Because of the shape of the oxyhemoglobin dissociation curve, the improved oxygenation in well-ventilated areas cannot compensate for the low Po2 in the poorly ventilated areas, resulting in lower Pao(2) or arterial hypoxemia.
Clinically, in V˙ /Q˙ mismatch, administering 100% oxygen can achieve a Po(2) on the plateau of the oxyhemoglobin dissociation curve even in poorly ventilated alveoli. Conversely, administering 100% oxygen in the presence of an intrapulmonary shunt only adds more dissolved oxygen in the normally perfused alveoli, although as seen in Fig. 9, this may result in more improvement in oxygenation than is often appreciated. Arterial hypoxemia remaining despite administration of 100% oxygen is always caused by the presence of an intrapulmonary shunt.
Diffusion Impairment
Diffusion impairment is not equivalent to low diffusing capacity. For diffusion impairment to cause an A-a gradient, equilibrium has not occurred between the Po(2) in the alveolus and the Po(2) in pulmonary capillary blood. This rarely occurs, even in patients with limited diffusing capacity. The small A-a gradient that can result from diffusion impairment is easily eliminated with supplemental oxygen, making this a clinically unimportant problem. Clinically significant diffusion impairment can occur with exercise at extreme altitude, owing both to the smaller driving oxygen partial pressure and the limited time for equilibrium because of the rapid transit of blood through the pulmonary capillaries.
Venous Oxygen Saturation
Low SvO(2) causes a subtle but important effect when intrapulmonary shunt is already present.(12) Shunt is a mixture of venous blood and blood from normal regions of the lungs. If the SvO(2) is lower, the resulting mixture must have a lower Pao(2). Low CO may lower SvO(2) significantly. This changes the way in which we interpret intrapulmonary shunt in different clinical conditions. For example, in sepsis, when the SvO(2) may be quite high, the shunt fraction may be higher than expected; high SvO(2) may be described as covering up a high shunt fraction.
Carbon Dioxide
Carbon dioxide is produced in the tissues and removed from the lungs by ventilation. Carbon dioxide is carried in the blood as dissolved gas, as bicarbonate, and as a small amount bound to hemoglobin as carbaminohemoglobin. Unlike the oxyhemoglobin dissociation curve, the dissociation curve for carbon dioxide is essentially linear.
Hypercapnia
Hypercapnia (i.e., high Paco(2)) may be a sign of respiratory difficulty or oversedation with opioids. Although hypercapnia itself may not be dangerous, Paco(2) values greater than 80 mm Hg may cause CO(2) narcosis, possibly contributing to delayed awakening in the postanesthesia care unit. The greatest concern of hypercapnia is that it may indicate a risk of impending respiratory failure and apnea, in which arterial hypoxemia and anoxia can rapidly ensue. Although the presence of hypercapnia may be obvious if capnography is used, this monitor is not always available, and substantial hypercapnia may go unnoticed. Supplemental oxygen can prevent arterial hypoxemia despite severe hypercapnia, and an analysis of arterial blood gases would not necessarily be performed if hypercapnia were not suspected (see Fig.8).
The organ systems impacted by hypercapnia include the lungs (pulmonary vasoconstriction, right-shift of hemoglobin-oxygen dissociation curve), kidneys (renal bicarbonate resorption), central nervous system (somnolence, cerebral vasodilation), and heart (coronary artery vasodilation, decreased cardiac contractility). (13,14)
Determinants of Arterial Carbon Dioxide Partial Pressure
Paco(2) is a balance of production and removal. If removal exceeds production, Paco(2) decreases. If production exceeds removal, Paco(2) increases. The resulting Paco(2) is expressed by an alveolar carbon dioxide equation:
PaCO2 =k ×V˙ CO2/V˙ A
In the equation, k is a constant (0.863) that corrects units, V˙ CO(2) is carbon dioxide production, and V˙ a is alveolar ventilation.
Rebreathing
Because breathing circuits with rebreathing properties are frequently used in anesthesia, increased inspired Pco(2) concentrations is a potential cause of hypercapnia. Exhausted carbon dioxide absorbents and malfunctioning expiratory valves on the anesthesia delivery circuit are possible causes of rebreathing in the operating room that are easily detected with capnography. Use of certain transport breathing circuits may be the most common cause of clinically significant rebreathing, which may be unrecognized because capnography is not routinely used during patient transport from the operating room.
Increased Carbon Dioxide Production
Several important physiologic causes of increased carbon dioxide production may cause hypercapnia under anesthesia. The anesthesia provider should not view CO(2) production in terms of cellular production but rather as the pulmonary excretion of CO(2). This is how it would be measured clinically and how it would be detected by the homeostatic mechanisms of the body. Other brief increases in CO(2) production may occur when administering sodium bicarbonate, which is converted into CO(2), or when releasing a tourniquet, where carbon dioxide has accumulated in the tissues of the leg and then returns to the circulation.
Increased Dead Space
Dead space, or “wasted ventilation,” refers to areas receiving ventilation that do not participate in gas exchange. Dead space is further categorized as anatomic, alveolar, and physiologic (total) dead space. Anatomic dead space represents areas of the tracheobronchial tree that are not involved in gas exchange. This includes equipment dead space, such as the endotracheal tube and tubing distal to the Y-connector of the anesthesia delivery circuit. Alveolar dead space represents alveoli that do not participate in gas exchange owing to lack of blood flow. Physiologic or total dead space represents the sum of anatomic and alveolar dead space. Most pathologically significant changes in dead space represent increases in alveolar dead space.
Dead space is increased in many clinical conditions. Emphysema and other end-stage lung diseases, such as cystic fibrosis, are often characterized by substantial dead space. Pulmonary embolism is a potential cause of significant increases in dead space. Physiologic processes that decrease PAP, such as hemorrhagic shock, can be expected to increase dead space (increased zone 1). Increased airway pressure and positive end-expiratory pressure (PEEP) can also increase dead space.
Quantitative estimates of dead space are described by the Bohr equation, which expresses the ratio of dead space ventilation ( V˙ D ) relative to tidal ventilation ( V˙ T ):
V˙ D/V˙ T=(PaCO(2) −PECO(2))/PaCO(2)
where PECO(2) is the mixed-expired carbon dioxide.
For example, if the PaCO(2) = 40 mm Hg and the PECO(2) = 20 mm Hg during controlled ventilation of the lungs, the V˙ D/V˙ T can be calculated as follows:
V˙ D/V˙ T= (40−20) /40
= 20/40
= 0.5
Some physiologic dead space (25% to 30%) is considered normal because some anatomic dead space is always present. The Paco(2) − Petco(2) gradient is a useful indication of the presence of alveolar dead space. However, this gradient will change as Paco(2) changes with hyperventilation or hypoventilation even when dead space is constant.
Hypoventilation
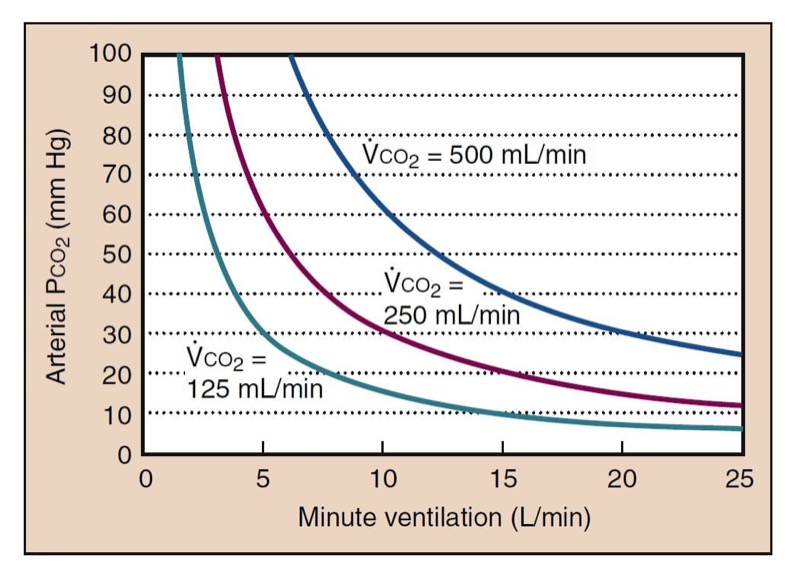
Decreased minute ventilation is the most important and common cause of hypercapnia (Fig. 11). This may be due to decreased tidal volume, breathing frequency, or both. Alveolar ventilation ( V˙ A ) combines minute ventilation and dead space ( V˙ A=V˙ T−V˙ D ); however, it is more clinically useful to separate these processes. Ventilatory depressant effects of anesthetic drugs are a common cause of hypoventilation. Although increased minute ventilation can often completely compensate for elevated carbon dioxide production, rebreathing, or dead space, there is no physiologically useful compensation for inadequate minute ventilation.
If alveolar ventilation decreases by one half, Paco(2) should double (see Fig. 11). This change occurs over several minutes as a new steady state develops. CO(2) changes during apnea are more complicated. During the first minute of apnea, PaCO(2) increases from a normal of 40 mm Hg to 46 mm Hg (the normal PvCO(2)). This increase may be higher and more rapid in patients with smaller lung volumes or high arterial-to-venous carbon dioxide differences. After the first minute, Paco(2) increases more slowly as carbon dioxide production adds carbon dioxide to the blood, at about 3 mm Hg per minute.

- Fig. 11 Carbon dioxide has a hyperbolic relationship with ventilation. The depicted curves are simulated with a normal resting carbon dioxide production (250 mL/min), low carbon dioxide production (125 mL/min, as during anesthesia), and increased carbon dioxide production (500 mL/min, as during moderate exercise). The value of physiologic dead space is assumed to be 30% in these calculations.
Differential Diagnosis of Increased Arterial Carbon Dioxide Partial Pressure
Increased Paco(2) values can be analyzed by assessing minute ventilation, capnography, and measuring an arterial blood gas value. Capnography can easily detect rebreathing. A clinical assessment of minute ventilation by physical examination and as measured by most mechanical ventilators should be adequate. Comparison of end-tidal Pco(2) with Paco(2) can identify abnormal alveolar dead space. Abnormal carbon dioxide production can be inferred. However, significant abnormalities of carbon dioxide physiology often are unrecognized when Paco2 is normal, because increased minute ventilation can compensate for substantial increases in dead space and carbon dioxide production. Noticing the presence of increased dead space when minute ventilation is increased in volume and Paco(2) is 40 mm Hg is just as important as noticing abnormal dead space when the Paco (2) is 80 mm Hg and minute ventilation is normal.
6. PULMONARY MECHANICS
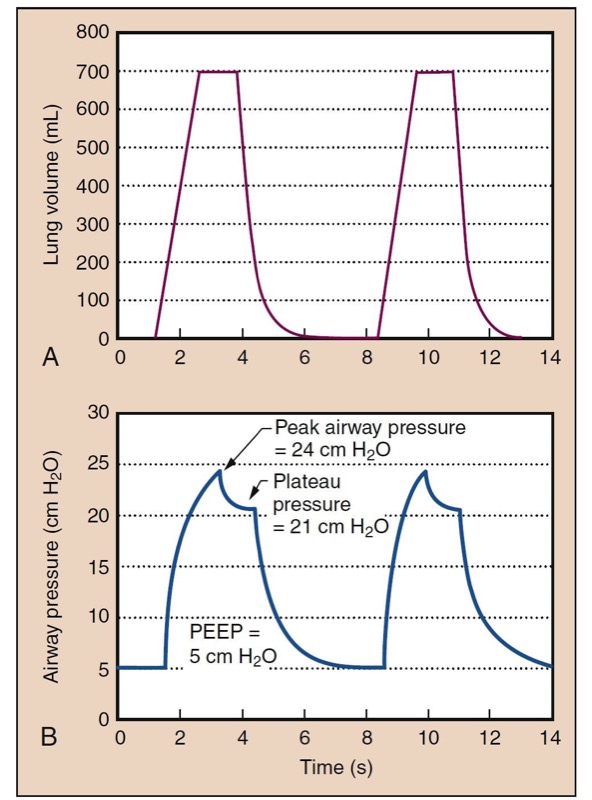
Pulmonary mechanics concerns pressure, volume, and flow relationships in the lung and bronchial tree (Fig. 12). An understanding of pulmonary mechanics is essential for managing the ventilated patient. Pressures in the airway are routinely measured or sensed by the anesthesia provider delivering positive-pressure ventilation.

- Fig. 12 Lung volume is shown as a function of time (A) in a typical volume-controlled ventilator with constant flow rates. Lung volume increases at a constant rate during inspiration because of constant flow. Exhalation occurs with a passive relaxation curve. The lower panel (B) shows the development of pressure over time. Pressure is produced from a static compliance component (see Fig. 13) and a resistance component. If flow is held at the plateau, a plateau pressure is reached, where there is no resistive pressure component. In this example, peak airway pressure (PAP) is 24 cm H2O, and positive end-expiratory pressure (PEEP) is 5 cm H2O. Dynamic compliance is tidal volume (Vt): (Vt)/(PAP − PEEP) = 37 mL/cm H2O. Plateau pressure (Pplat) is 21 cm H2O, and static compliance is Vt/(Pplat − PEEP) = 44 mL/cm H2O.
Static Properties
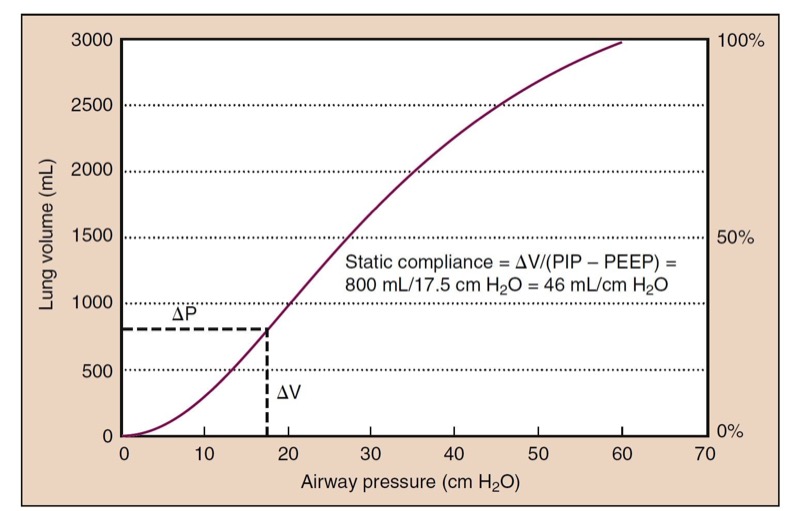
The lung is made of elastic tissue that stretches under pressure (Fig. 13). Surface tension has a significant role in the compliance of the lung because of the air-fluid interface in the alveoli. Surfactant decreases surface tension and stabilizes small alveoli, which would otherwise tend to collapse.
The chest wall has its own compliance curve. At FRC, the chest wall tends to expand, but negative (subatmospheric) intrapleural pressure keeps the chest wall collapsed. The lungs tend to collapse, but they are held expanded due to the pressure difference from the airways to the intrapleural pressure. FRC is the natural balance point between the lungs tending to collapse and chest wall tending to expand.

- Fig. 13 A static compliance curve of a normal lung has a slight S shape. Slightly higher pressure can be required to open alveoli at low lung volumes (i.e., beginning of the curve), whereas higher distending pressures are needed as the lung is overdistended. Static compliance is measured as the change (Δ) in volume divided by the change in pressure (inspiratory pressure [PIP] − positive end-expiratory pressure [PEEP]), which is 46 mL/cm H2O in this example.
Dynamic Properties and Airway Resistance
Airway resistance is mainly determined by the radius of the airway, but turbulent gas flow may make resistance worse. A number of clinical processes can affect airway resistance
During positive-pressure ventilation, resistance in anesthesia breathing equipment or airways manifests as elevated airway pressures, because flow through resistance causes a pressure change. Distinguishing airway resistance effects from static compliant components is a useful first step in the differential diagnosis of high peak airway pressures. This is facilitated by anesthesia machines that are equipped to provide an inspiratory pause. During ventilation, airway pressure reaches a peak inspiratory pressure, but when ventilation is paused, the pressure component from gas flow and resistance disappears, and the airway pressure decreases toward a plateau pressure (see Fig. 12).
7. CONTROL OF BREATHING
- Anesthesia providers are in a unique position to observe ventilatory control mechanisms because most drugs administered for sedation and anesthesia depress breathing.
Central Integration and Rhythm Generation
Specific areas of the brainstem are involved in generating the respiratory rhythm, processing afferent signal information, and changing the efferent output to the inspiratory and expiratory muscles.
Central Chemoreceptors
Superficial areas on the ventrolateral medullary surface respond to pH and Pco(2). Carbon dioxide is in rapid equilibrium with carbonic acid and therefore immediately affects the local pH surrounding the central chemoreceptors. Although the signal is transduced by protons, not carbon dioxide directly, these chemoreceptors are described clinically as carbon dioxide responsive. The central chemoreceptors are protected from rapid changes in metabolic pH by the blood-brain barrier.
Peripheral Chemoreceptors
Carotid bodies are the primary peripheral chemoreceptors in humans; aortic bodies have no significant role. Low Po2, high Pco2, and low pH stimulate the carotid bodies. (15) Unlike the central chemoreceptors, metabolic acids immediately affect peripheral chemoreceptors. Because of high blood flow, peripheral chemoreceptors are effectively at arterial, not venous, blood values.
Hypercapnic Ventilatory Response
Ventilation increases dramatically as Paco(2) is increased. In the presence of high Po2 values, most of this ventilatory response results from the central chemoreceptors, whereas in the presence of room air, about one third of the response results from peripheral chemoreceptor stimulation. The ventilatory response to carbon dioxide is moderately linear, although at Paco(2) levels below resting values, minute ventilation does not tend to go to zero because of an “awake” drive to breathe (Fig. 14). At a high Paco2 value, minute ventilation is eventually limited by maximal minute ventilation.

- Fig. 14 The hypercapnic ventilatory response (HCVR) is measured as the slope of the plot of Pco2 versus minute ventilation ( ˙ VE). End-tidal Pco(2) is usually substituted for Paco(2) for clinical studies. The apneic threshold is the Pco2 at which ventilation is zero. It can be extrapolated from the curve, but it is difficult to measure in awake volunteers, although it is easy to observe in patients under general anesthesia. A depressed carbon dioxide response results from opioids, which lower the slope and raise the apneic threshold.
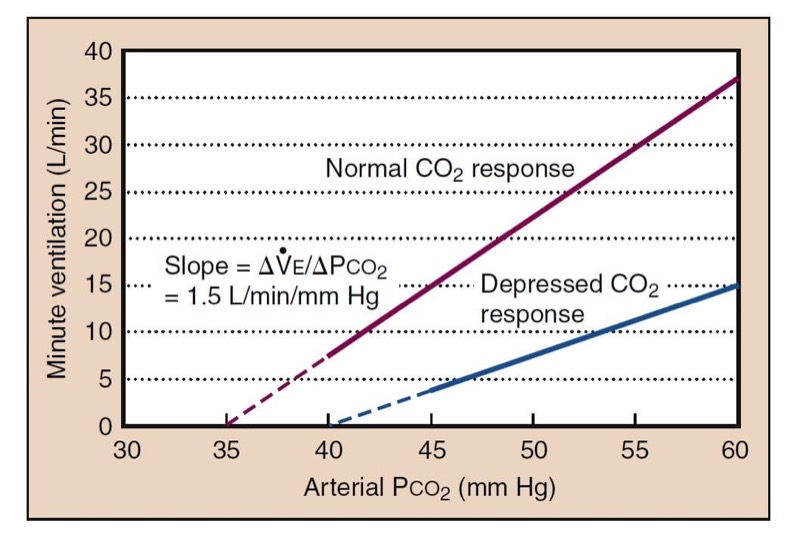
Decreasing Paco2 during anesthesia, as produced by assisted ventilation, results in a point at which ventilation ceases, called the apneic threshold. As CO(2) rises, ventilation returns at the apneic threshold and then stabilizes at a Paco(2) setpoint that is about 5 mm Hg higher.
The brainstem response to carbon dioxide is slow, requiring about 5 minutes to reach 90% of steady-state ventilation. When allowing the Paco(2) to rise in an apneic patient, it may take a noticeably long time to stabilize minute ventilation, which is a direct consequence of the dynamics of the central ventilatory drive.
Hypoxic Ventilatory Response
Ventilation increases as Pao(2) and Sao(2) decrease, reflecting stimulation of the peripheral chemoreceptors. The central response to hypoxemia actually results in decreased minute ventilation, called hypoxic ventilatory decline (HVD). The timing and combination of these effects mean that in prolonged arterial hypoxemia, ventilation rises to an initial peak, reflecting the rapid response of the peripheral chemoreceptors, and then decreases to an intermediate plateau in 15 to 20 minutes, reflecting the slower addition of HVD.
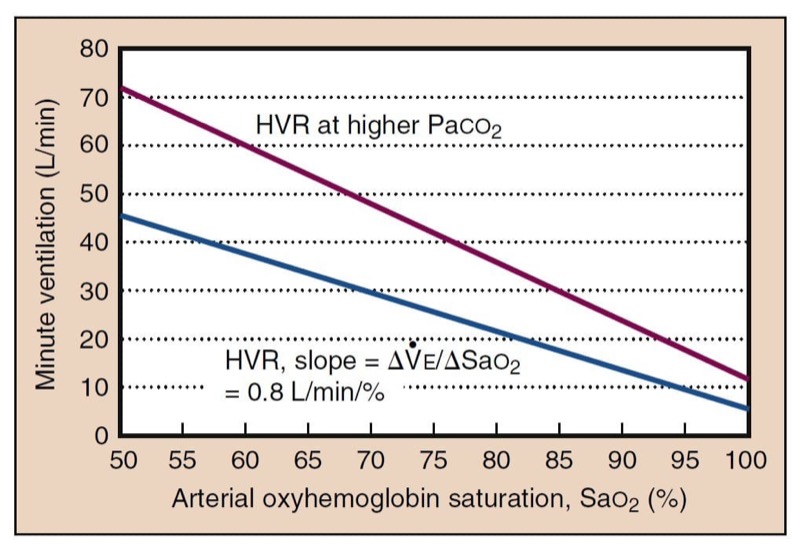
Although it is Po(2) that affects the carotid body, it is easier to consider the hypoxic ventilatory response in terms of oxyhemoglobin desaturation because minute ventilation changes linearly with Sao(2) (Fig. 15). The effects of hypoxia and hypercapnia on the carotid body are synergistic. At high Paco(2) levels, the response to hypoxia is much larger, whereas low Paco(2) levels can dramatically decrease responsiveness. Unlike the hypercapnic ventilatory response, the response to hypoxia is rapid and takes only seconds to appear.

- Fig. 15 Hypoxic ventilatory response (HVR) expressed relative to Sao(2) is approximately linear, which is simpler than the curvilinear response expressed as a function of Pao(2). HVR is the slope of the linear plot. HVR is higher at higher carbon dioxide concentrations. Both absolute ventilation and the slope are shifted. Low Paco(2) likewise lowers HVR.
Effects of Anesthesia

- Opioids, sedative-hypnotics, and volatile anesthetics have dose-dependent depressant effects on ventilation and ventilatory control. Opioid receptors are present on neurons considered responsible for respiratory rhythm generation. Sedative-hypnotics work primarily on γ-aminobutyric acid A receptors (GABAA), which provide inhibitory input in multiple neurons of the respiratory system. Volatile anesthetics decrease excitatory neurotransmission. All of these drugs exert most of their depressant effects in the central integratory area and therefore clinically appear to decrease the hypoxic and hypercapnic ventilatory responses similarly. Specific effects of drugs on peripheral chemoreceptors include the inhibitory effects of dopamine and the slight excitatory effects of dopaminergic blockers such as haloperidol.
Disorders of Ventilatory Control
Neonates with a history of prematurity and of postconceptual age <60 weeks may have episodes of apnea after anesthesia. Likewise, sudden infant death syndrome may be a result of immature ventilatory control systems. Ondine’s curse, originally described after surgery near the upper cervical spinal cord, results in profound hypoventilation during sleep and anesthesia due to abnormalities in the central integratory system that seem to blunt the hypoxic and hypercapnic ventilatory responses. Idiopathic varieties of Ondine’s curse have occurred in children and are referred to as primary central alveolar hypoventilation syndromes. Morbidly obese patients and those with sleep apnea may exhibit abnormalities of ventilatory control.
Periodic breathing is commonly observed during druginduced sedation. Mechanistically, this is most likely when peripheral chemoreceptors are activated by mild arterial hypoxemia. Continual overcorrection and undercorrection of the Pao(2) leads to oscillations of Paco(2) and Sao(2). Periodic breathing is also common during sleep at higher altitudes.
8. INTEGRATION OF THE HEARTH AND LUNGS
The interrelationship between the heart and lungs is suggested by the Fick equation, which relates oxygen consumption and oxygen needs at the tissue level:
V˙ O(2) =CO × (CaO(2) −CvO(2))
where V˙ O(2) is oxygen consumption, Cao(2) is the arterial oxygen content, and CvO(2) is the mixed venous oxygen content.
Oxygen Delivery
Oxygen delivery (Do(2)) is the total amount of oxygen supplied to tissues and is a function of CO and Cao(2):
DO(2) = CO × CaO(2)
Do2 can be limited by decreases in CO or Cao(2). Cao(2) can be limited by anemia or hypoxemia.
Oxygen Extraction
Different indices can be used to assess how much oxygen is removed from blood by tissues to meet their metabolic demand. Mixed venous oxygen saturation (SvO(2)) is normally about 75%. If tissues extract more oxygen, SvO(2) decreases. However, with high Fio(2), SvO(2) may increase because of the added amount of dissolved oxygen, even though true extraction has not changed. The arteriovenous oxygen content difference (CaO(2) − CvO(2)) is independent of changes in Fio2 and is therefore a useful measurement of the balance of oxygen supply and demand. On the other hand, the arteriovenous oxygen content difference decreases in anemia because extracting the same percentage of oxygen means extracting less total oxygen because of the lower hemoglobin concentration. The most reliable figure is the calculated oxygen extraction ratio:
O(2) extraction = (CaO(2) − CvO(2))/CaO(2)
Anemia
An example of threatened oxygen supply is anemia. To adapt to anemia, the body can increase CO or extract more oxygen. The normal physiologic response is to increase CO and maintain Do(2). Increased HR and SV are responsible for this compensation. However, during anesthesia with a near-absent HR response, increased oxygen extraction is a more important mechanism of compensation. (16)
Metabolic Demand
Increased oxygen consumption is usually met with a combination of increased CO and increased oxygen extraction. Whereas oxygen consumption is usually constant and relatively low under anesthesia, recovery from anesthesia may be associated with significant increases in metabolic demands. Shivering and early ambulation after outpatient surgery are stresses that may affect patients still recovering from anesthesia or after significant blood loss. Increased minute ventilation is required to meet increased oxygen needs and to eliminate the extra carbon dioxide produced.
PRACTICAL
The gold-standard text in anesthesiology; used by everyone worldwide
BE INSPIRED
BONUS: INFOGRAPHICS
The best-selling practical book
enhanced with Flash Cards for tests
preparation.
UNDERSTAND
Make our own study scripts, insert images, YouTube or own videos, literature and never loose them.
READ OR LISTEN.
Learn according to your study style. Read or listen to the voiced-over material.
9. QUESTIONS OF THE DAY
1. What clinical conditions can lead to a low preload? How does systemic vascular resistance affect cardiac filling pressures?
2. What physiologic model can be used to describe changes in the pulmonary circulation? How do small and large lung volumes affect pulmonary vascular resistance?
3. How can the A-a gradient, PaO2 to FIO2 ratio, or isoshunt diagram be used to quantitate abnormalities of oxygenation? Which measurement of oxygenation depends the most on FIO2?
4. What are the determinants of arterial carbon dioxide partial pressure? What clinical conditions can cause hypercapnia during general anesthesia?
5. What is the physiologic basis for the hypercapnic ventilatory response and the hypoxic ventilatory response? What is the typical time course of these responses?