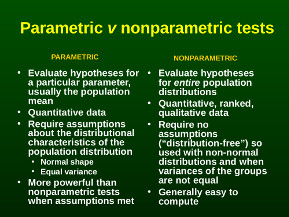
Both parametric and nonparametric tests can be used to evaluate hypotheses, and choice of which procedure to use depends on the type of variable analyzed and its characteristics . In general, the parametric tests are applied to quantitative data, such as comparing time to place a peripheral nerve block (PNB) among obese, normal weight, and thin patients in a 1-way analysis of variance. On the other hand, the nonparametric tests can be applied to quantitative, ranked or qualitative data, such as comparing ASA physical status and gender in a 6 x 2 chi-square.
Investigators often assume that the parametric tests are the “better” ones. If a quantitative variable has the bell-shape of the normal curve and the groups being compared have similar variability, parametric tests are indeed more powerful in detecting group differences than their nonparametric counterparts.

However, data analysts do not chose tests solely on their power. In the first example, a chi-square analysis would not be used unless the distribution for time to place a PNB has a non-normal shape requiring that it be split, say, into quartiles, before being compared in a 4 (time quartiles) x 3 (weight categories) chi-square. In the second example, a Student’s t test would not be used to compare ASA physical status between males and females because ASA physical status is a non-continuous ranked variable.
In summary, choice of test should be driven by the type of variables being analyzed and their distributional characteristics. As studies are likely to contain all types of data, findings from a mix of these methods are usually reported. Next month, statistics in small doses will discuss the null and alternative hypotheses that are addressed by the parametric and nonparametric tests.


