Daquan Xu
INTRODUCTION
Ultrasound application allows for noninvasive visualization of tissue structures. Real-time ultrasound images are integrated images resulting from reflection of organ surfaces and scattering within heterogeneous tissues. Ultrasound scanning is an interactive procedure involving the operator, patient, and ultrasound instruments. Although the physics behind ultrasound generation, propagation, detection, and transformation into practical information is rather complex, its clinical application is much simpler. Because ultrasound imaging has improved tremendously over the last decade, it can provide anesthesiologists opportunity to directly visualize target nerve and relevant anatomical structures. An ultrasound-guided nerve block is a critical growth area for new applications of ultrasound technology and has become an essential part of regional anesthesia. Understanding the basic ultrasound physics presented in this section will be helpful for anesthesiologists to appropriately select the transducer, set the ultrasound system, and then obtain satisfactory imaging.
HISTORY OF ULTRASOUND
In 1880, French physicists Pierre Curie and his elder brother, Paul-Jacques Curie, discovered the piezoelectric effect in certain crystals. Paul Langevin, a student of Pierre Curie, developed piezoelectric materials, which can generate and receive mechanical vibrations with high frequency (therefore ultrasound). During World War I, ultrasound was introduced in the navy as a means to detect enemy submarines. In the medical field, however, ultrasound was initially used for therapeutic rather than diagnostic purposes. In the late 1920s, Paul Langevin discovered that high-power ultrasound could generate heat in bone and disrupt animal tissues. As a result, throughout the early 1950s ultrasound was used to treat patients with Ménière disease, Parkinson disease, and rheumatic arthritis. Diagnostic applications of ultrasound began through the collaboration of physicians and sonar (sound navigation ranging) engineers. In 1942, Karl Dussik, a neuropsychiatrist, and his brother, Friederich Dussik, a physicist, described ultrasound as a medical diagnostic tool to visualize neoplastic tissues in the brain and the cerebral ventricles. However, limitations of ultrasound instrumentation at the time prevented further development of clinical applications until the mid-1960s. The real-time B-scanner was developed in 1965 and was first introduced in obstetrics. In 1976, the first ultrasound machines coupled with Doppler measurements were commercially available. With regard to regional anesthesia, as early as 1978, La Grange and his colleagues were the first anesthesiologists to publish a case series report of ultrasound application for peripheral nerve block. They simply used a Doppler transducer to locate the subclavian artery and performed supraclavicular brachial plexus block in 61 patients (Figures 1A and 1B). Reportedly, Doppler guidance led to a high block success rate (98%) and absence of complications such as pneumothorax, phrenic nerve palsy, hematoma, convulsion, recurrent laryngeal nerve block, and spinal anesthesia. In 1989, Ting and Sivagnanaratnam reported the use of B-mode ultrasonography to demonstrate the anatomy of the axilla and to observe the spread of local anesthetics during axillary brachial plexus block.
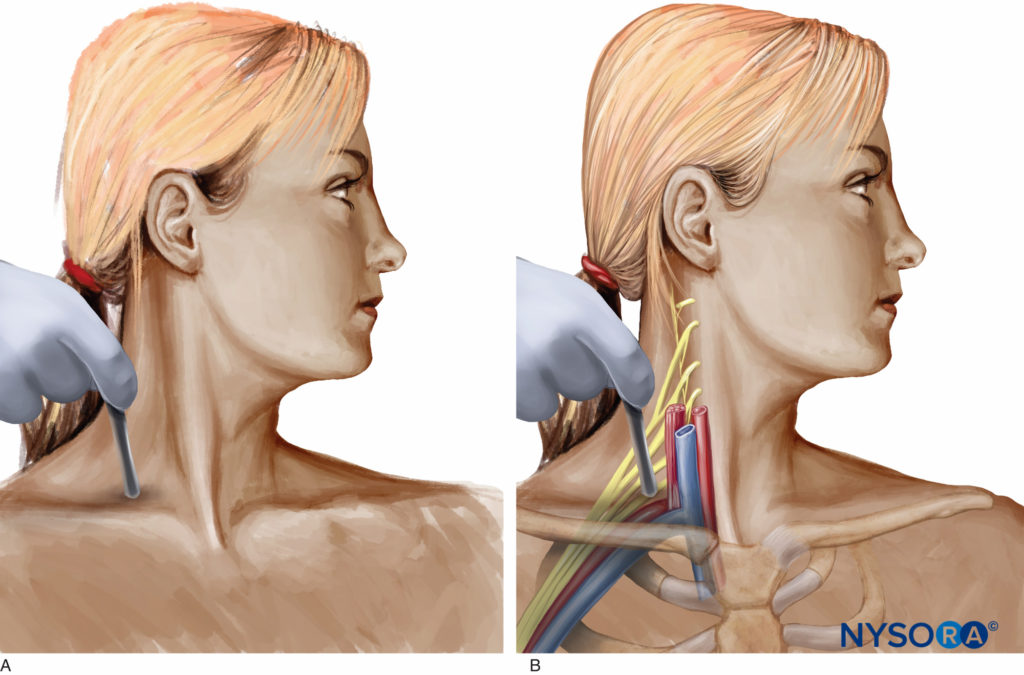
Figure 1. A: Early application of Doppler ultrasound by LaGrange to perform a supraclavicular brachial block. B: Relationship of the brachial plexus of nerves and the subclavian artery.
In 1994, Stephan Kapral and colleagues systematically explored brachial plexus with B-mode ultrasound. Since that time, multiple teams worldwide have worked tirelessly to define and improve the application of ultrasound imaging in regional anesthesia. Ultrasound-guided nerve block is currently used routinely in the practice of regional anesthesia in many centers worldwide.
Here is a summary of ultrasound quick facts:
- 1880: Pierre and Jacques Curie discovered the piezoelectric effect in crystals.
- 1915: Ultrasound was used by the navy for detecting submarines.
- 1920s: Paul Langevin discovered that high-power ultrasound can generate heat in osseous tissues and disrupt animal tissues.
- 1942: The Dussik brothers described ultrasound use as a diagnostic tool.
- 1950s: Ultrasound was used to treat patients with Ménière disease, Parkinson disease, and rheumatic arthritis.
- 1965: The real-time B-scan was developed and was introduced in obstetrics.
- 1978: La Grange published the first case series of ultrasound application for placement of needles for nerve blocks.
- 1989: Ting and Sivagnanaratnam used ultrasonography to demonstrate the anatomy of the axilla and to observe the spread of local anesthetics during an axillary block.
- 1994: Steven Kapral and colleagues explored brachial plexus block using B-mode ultrasound.
Definition of Ultrasound
Sound travels as a mechanical longitudinal wave in which back-and-forth particle motion is parallel to the direction of wave travel. Ultrasound is high-frequency sound and refers to mechanical vibrations above 20 kHz. Human ears can hear sounds with frequencies between 20 Hz and 20 kHz. Elephants can generate and detect sound with frequencies less than 20 Hz for long-distance communication; bats and dolphins produce sounds in the range of 20 to 100 kHz for precise navigation (Figures 2A and 2B). Ultrasound frequencies commonly used for medical diagnosis are between 2 and 15 MHz. However, sounds with frequencies above 100 kHz do not occur naturally; only human-developed devices can both generate and detect these frequencies, or ultrasounds.
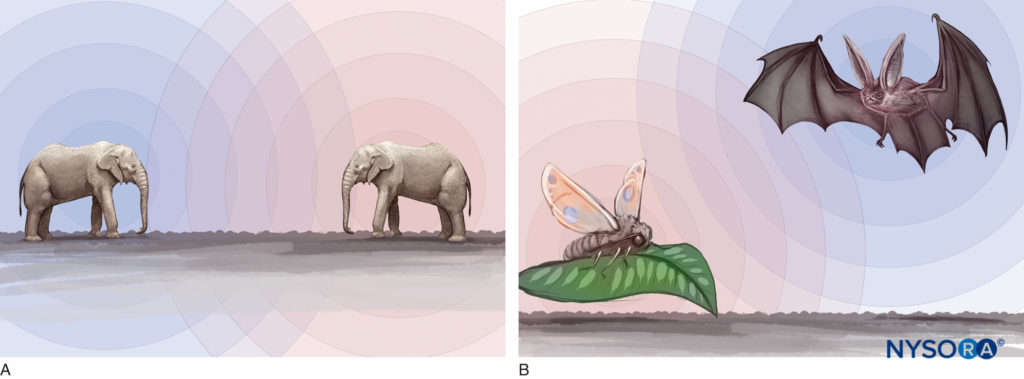
Figure 2. A: Elephants can generate and detect the sound of frequencies less than 20 Hz for long-distance communication. B: Bats and dolphins produce sounds in the range of 20–100 kHz for navigation and spatial orientation.
Piezoelectric Effect
Ultrasound waves can be generated by material with a piezoelectric effect. The piezoelectric effect is a phenomenon exhibited by the generation of an electric charge in response to a mechanical force (squeeze or stretch) applied on certain materials. Conversely, mechanical deformation can be produced when an electric field is applied to such material, also known as the piezoelectric effect (Figure 3). Both natural and human-made materials, including quartz crystals and ceramic materials, can demonstrate piezoelectric properties. Recently, lead zirconate titanate has been used as piezoelectric material for medical imaging. Lead-free piezoelectric materials are also under development. Individual piezoelectric materials produce a small amount of energy. However, by stacking piezoelectric elements into layers in a transducer, the transducer can convert electric energy into mechanical oscillations more efficiently. These mechanical oscillations are then converted into electric energy.

Figure 3. The piezoelectric effect. Mechanical deformation and consequent oscillation caused by an electrical field applied to certain material can produce a sound of high frequency.
Ultrasound Terminology
Period is the time for a sound wave to complete one cycle; the period unit of measure is the microsecond (µs). Wavelength is the length of space over which one cycle occurs; it is equal to the travel distance from the beginning to the end of one cycle. Frequency is the number of cycles repeated per second and measured in hertz (Hz). Acoustic velocity is the speed at which a sound wave travels through a medium. It is equal to the frequency times the wavelength. Speed c is determined by the density ρ and stiffness κ of the medium (c = (κ/ρ)1/2). Density is the concentration of a medium. Stiffness is the resistance of a material to compression. Propagation speed increases if the stiffness is increased or the density is decreased.
The average propagation speed in soft tissues is 1540 m/s (ranges from 1400 to 1640 m/s). However, ultrasound cannot penetrate lung or bone tissues. Acoustic impedance z is the degree of difficulty demonstrated by a sound wave being transmitted through a medium; it is equal to density ρ multiplied by acoustic velocity c (z = ρc). It increases if the propagation speed or the density of the medium is increased. Attenuation coefficient is the parameter used to estimate the decrement of ultrasound amplitude in certain media as a function of ultrasound frequency. The attenuation coefficient increases with increasing frequency; therefore, a practical consequence of attenuation is that the penetration decreases as frequency increases (Figure 4).
Ultrasound waves have a self-focusing effect, which refers to the natural narrowing of the ultrasound beam at a certain travel distance in the ultrasonic field. It is a transition level between near field and far field. The beam width at the transition level is equal to half the diameter of the transducer. At the distance of two times the near-field length, the beam width reaches the transducer diameter. The self-focusing effect amplifies ultrasound signals by increasing acoustic pressure.
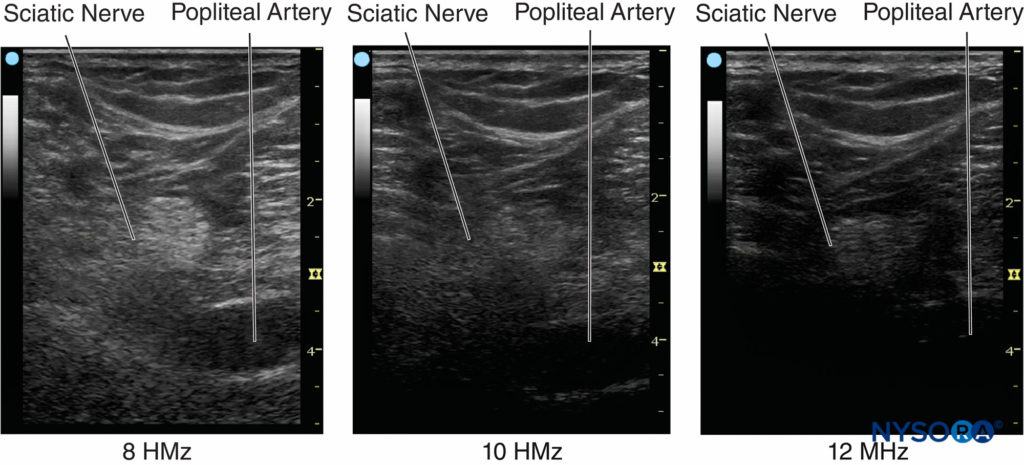
Figure 4. The ultrasound amplitude decreases in certain media as a function of ultrasound frequency, a phenomenon known as the attenuation coefficient. (Adapted with permission from Hadzic A: Hadzic’s Peripheral Nerve Blocks and Anatomy for Ultrasound-Guided Regional Anesthesia, 2nd ed. New York: McGraw-Hill, Inc; 2011.)
In ultrasound imaging, there are two aspects of spatial resolution: axial and lateral. Axial resolution is the minimum separation of above-below planes along the beam axis. It is determined by spatial pulse length, which is equal to the product of wavelength and the number of cycles within a pulse. It can be presented in the following formula:
Axial resolution = Wavelength λ × Number of cycles per pulse n ÷ 2
The number of cycles within a pulse is determined by the damping characteristics of the transducer. The number of cycles within a pulse is usually set between 2 and 4 by the manufacturer of the ultrasound machines. As an example, if a 2-MHz ultrasound transducer is theoretically used to do the scanning, the axial resolution would be between 0.8 and 1.6 mm, making it impossible to visualize a 21-gauge needle. For constant acoustic velocity, higher-frequency ultrasound can detect smaller objects and provide an image with better resolution. The axial resolution of current ultrasound systems is between 0.05 and 0.5 mm. Figure 5 shows images at different resolutions when a 0.5-mm diameter object is visualized with three different frequency settings.
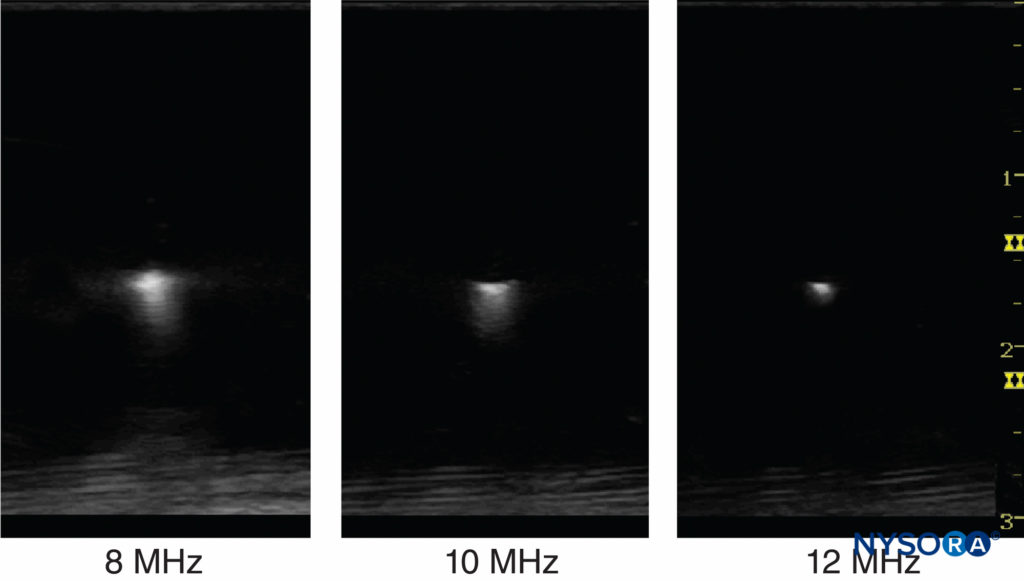
Figure 5. Ultrasound frequency affects the resolution of the imaged object. Resolution can be improved by increasing frequency and reducing the beam width by focusing. (Reproduced with permission from Hadzic A: Hadzic’s Peripheral Nerve Blocks and Anatomy for Ultrasound-Guided Regional Anesthesia, 2nd ed. New York: McGraw-Hill, Inc; 2011.)
Lateral resolution is another parameter of sharpness to describe the minimum side-by-side distance between two objects. It is determined by both ultrasound frequency and beam width. The higher frequencies have a narrower focus and provide better axial and lateral resolution. Lateral resolution can also be improved by adjusting focus to reduce the beam width.
Temporal resolution is also important for observing a moving object such as blood vessels and heart. Like a movie or cartoon video, the human eye requires that the image is updated at a rate of approximately 25 times a second or higher for an ultrasound image to appear continuous. However, imaging resolution will be compromised by increasing the frame rate. Optimizing the ratio of resolution to the frame rate is essential for providing the best possible image.
INTERACTIONS OF ULTRASOUND WITH TISSUES
As the ultrasound wave travels through tissues, it is subject to a number of interactions. The most important features are as follows:
- Reflection
- Scatter
- Absorption
When ultrasound encounters boundaries between different media, part of the ultrasound is reflected and the other part is transmitted. The reflected and transmitted directions are given by the reflection angle θr and transmission angle θt, respectively (Figure 6).
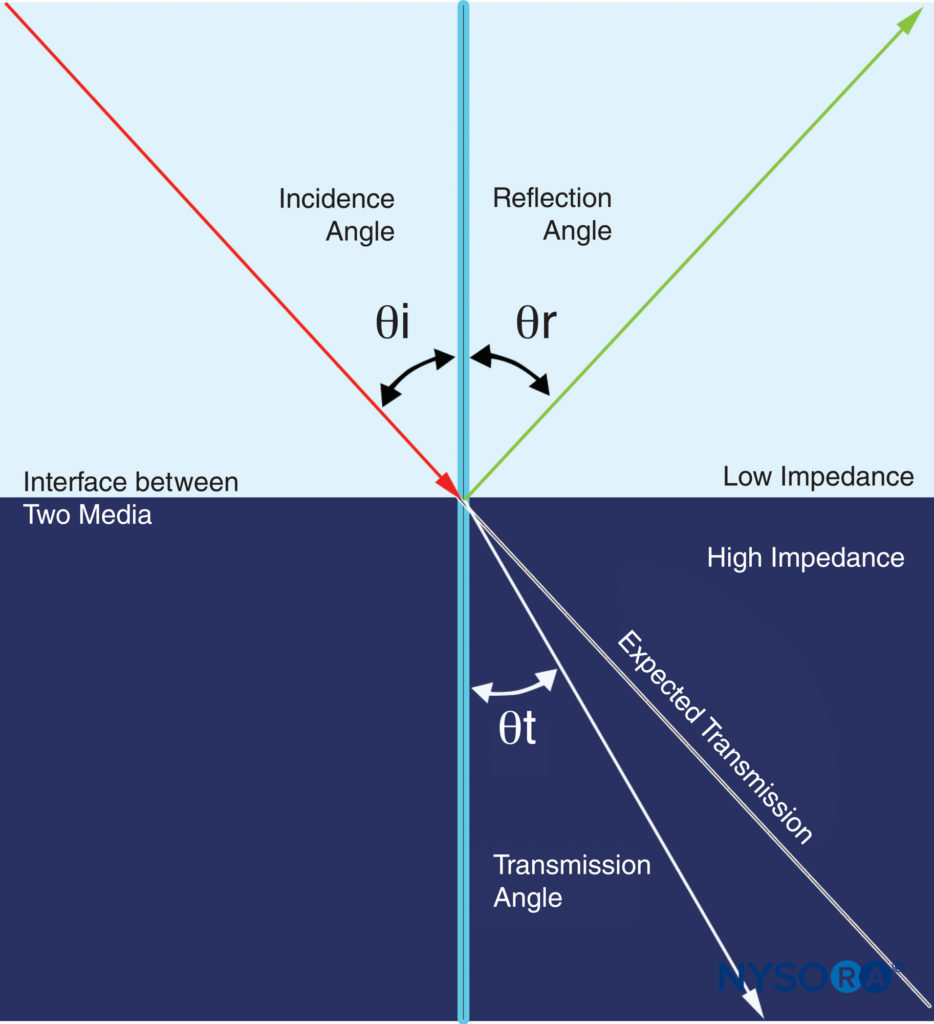
Figure 6. The interaction of ultrasound waves through the media in which they travel is complex. When ultrasound encounters boundaries between different media, part of the ultrasound is reflected and part is transmitted. The reflected and transmitted directions depend on the respective angles of reflection and transmission. (Adapted with permission from Hadzic A: Hadzic’s Peripheral Nerve Blocks and Anatomy for Ultrasound-Guided Regional Anesthesia, 2nd ed. New York: McGraw-Hill, Inc; 2011.)
Refection of sound waves is similar to optical reflection. Some of its energy is sent back into the medium from which it came. In a true reflection, the reflection angle θr must equal the incidence angle θi. The strength of the reflection from an interface is variable and depends on the difference of impedances between two affinitive media and the incident angle at the boundary. If the media impedances are equal, there is no reflection (no echo). If there is a significant difference between media impedances, there will be nearly complete reflection. For example, an interface between soft tissues and either lung or bone involves a considerable change in acoustic impedance and creates strong echoes. This reflection intensity is also highly angle dependent. In practical terms, it means that the ultrasound transducer must be placed perpendicular to the target nerve to visualize it clearly. A change in sound direction when crossing the boundary between two media is called refraction. If the propagation speed through the second medium is slower than that through the first medium, the refraction angle is smaller than the incident angle. Refraction can cause the artifact that occurs beneath large vessels on the image.
During ultrasound scanning, a coupling medium must be used between the transducer and the skin to displace air from the transducer-skin interface. A variety of gels and oils are applied for this purpose. Moreover, they can act as lubricants, making a smooth scanning performance possible. Most scanned interfaces are somewhat irregular and curved. If the boundary dimensions are significantly less than the wavelength or not smooth, the reflected waves will be diffused.
Scattering is the redirection of sound in any directions by rough surfaces or by heterogeneous media (Figure 7).
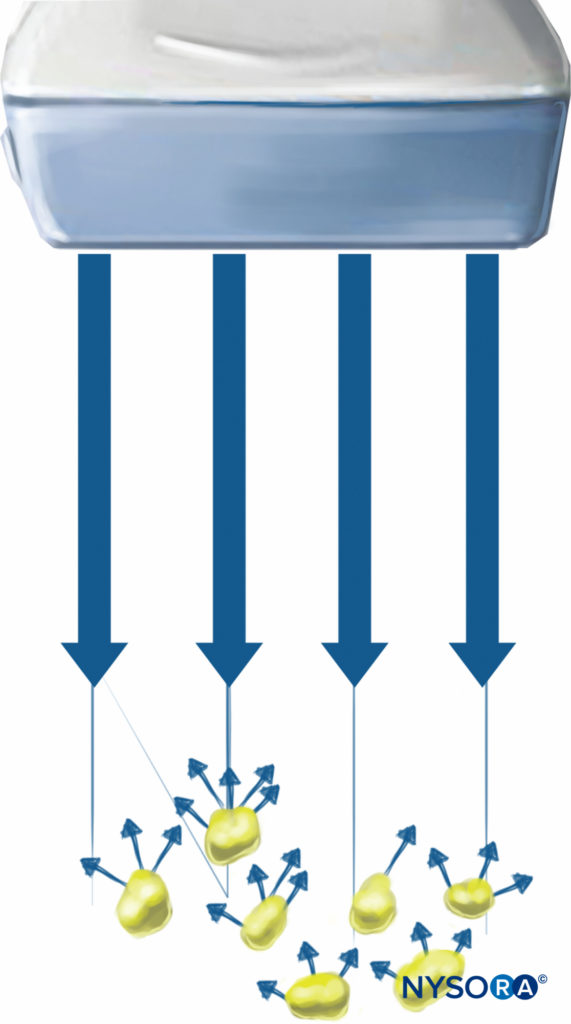
Figure 7. Scattering is the redirection of ultrasound in any direction caused by rough surfaces or by heterogeneous media. (Adapted with permission from Hadzic A: Hadzic’s Peripheral Nerve Blocks and Anatomy for Ultrasound-Guided Regional Anesthesia, 2nd ed. New York: McGraw-Hill, Inc; 2011.)
Normally, scattering intensity is much less than mirror-like reflection intensities and is relatively independent of the direction of the incident sound wave; therefore, the visualization of the target nerve is not significantly influenced by another nearby scattering.
Absorption is defined as the direct conversion of the sound energy into heat. In other words, ultrasound scanning generates heat in the tissue. Higher frequencies are absorbed in a greater rate than lower frequencies. However, a higher scanning frequency gives a better axial resolution. If the ultrasound penetration is not sufficient to visualize the structures of interest, a lower frequency is selected to increase the penetration. The use of longer wavelengths (lower frequency) results in lower resolution because the resolution of ultrasound imaging is proportional to the wavelength of the imaging wave. Frequencies between 6 and 12 MHz typically yield adequate resolution for imaging in peripheral nerve block, whereas frequencies between 2 and 5 MHz are usually needed for imaging of neuraxial structures. Frequencies of less than 2 MHz or higher than 15 MHz are rarely used because of insufficient resolution or the insufficient penetration depth in most clinical applications.
ULTRASOUND IMAGE MODES
A-Mode
The A-mode is the oldest ultrasound technique and was invented in 1930. The transducer sends a single pulse of ultrasound into the medium. Consequently, a one-dimensional simplest ultrasound image is created on which a series of vertical peaks is generated after ultrasound beams encounter the boundary of the different tissue. The distance between the echoed spikes (Figure 8) can be calculated by dividing the speed of ultrasound in the tissue (1540 m/s) by half the elapsed time, but it provides little information on the spatial relationship of imaged structures. Therefore, A-mode ultrasound is not applicable to regional anesthesia.
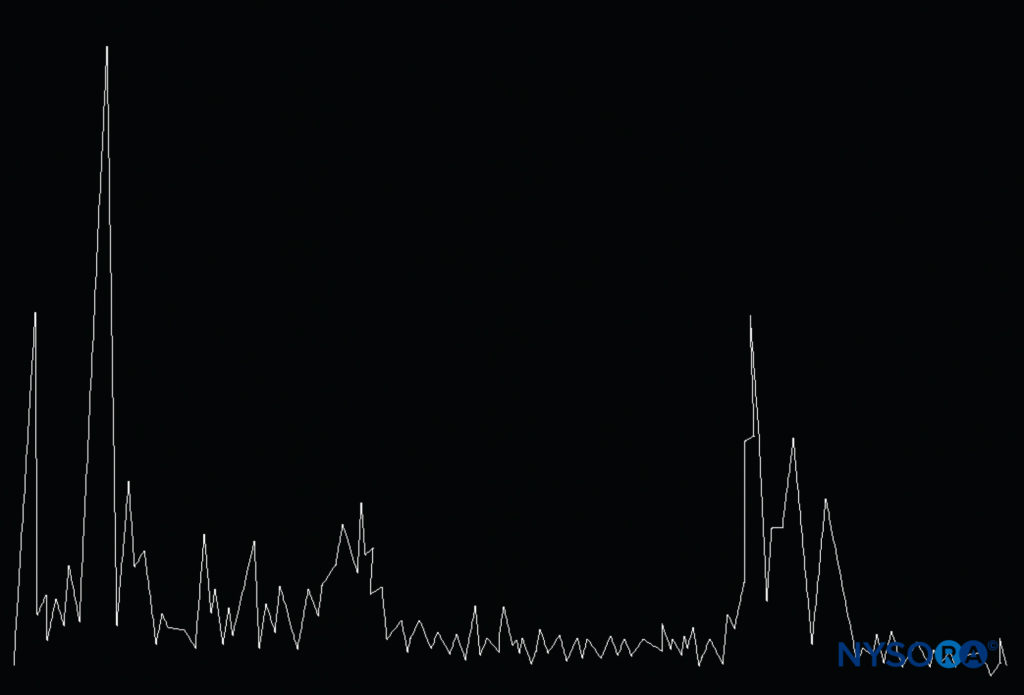
Figure 8. The A-mode of ultrasound consists of a one-dimensional ultrasound image displayed as a series of vertical peaks corresponding to the depth of structures the ultrasound encounters in different tissues. (Reproduced with permission from Hadzic A: Hadzic’s Peripheral Nerve Blocks and Anatomy for Ultrasound-Guided Regional Anesthesia, 2nd ed. New York: McGrawHill, Inc; 2011.)
B-mode
The B-mode is a two-dimensional (2D) image of the area that is simultaneously scanned by a linear array of 100–300 piezoelectric elements rather than a single one as in A-mode (Figure 9). The amplitude of the echo from a series of A-scans is converted into dots of different brightness in B-mode imaging. The horizontal and vertical directions represent real distances in tissue, whereas the intensity of the grayscale indicates echo strength (Figure 10). B-mode can provide an image of a cross section through the area of interest, and it is the primary mode currently used in regional anesthesia.
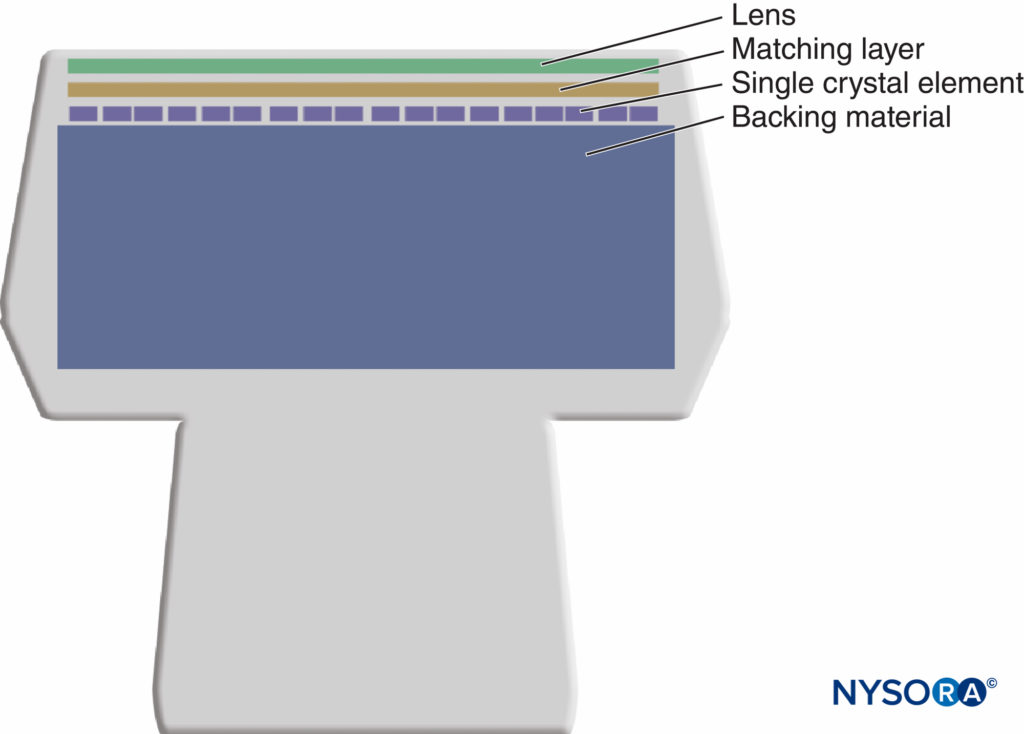
Figure 9. The B-mode transducer incorporates numeric piezoelectric elements that are electrically connected in parallel.
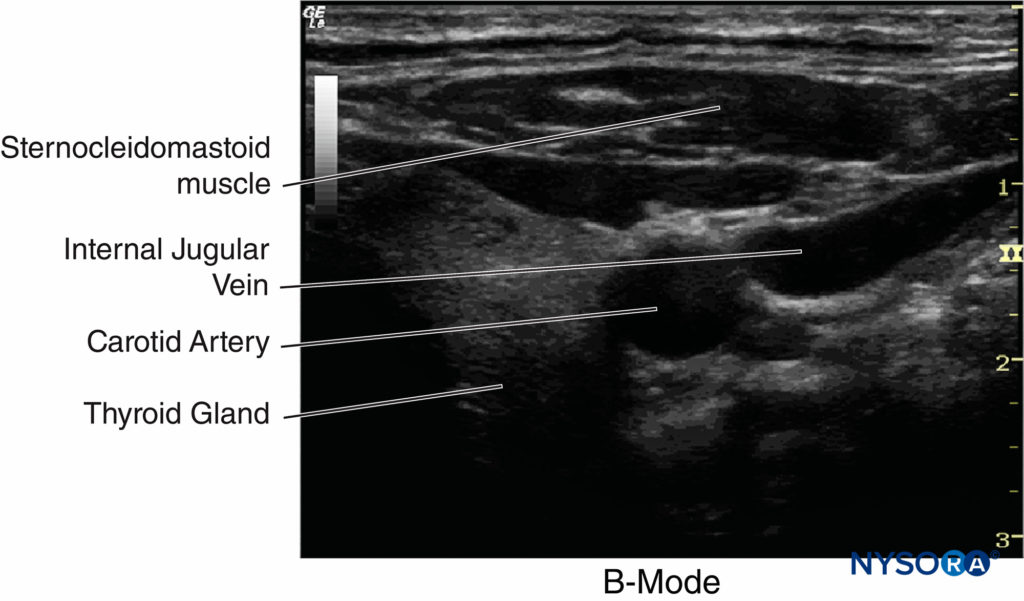
Figure 10. An example of B-mode imaging. The horizontal and vertical directions represent distances and tissues, whereas the intensity of the grayscale indicates echo strength. (Adapted with permission from Hadzic A: Hadzic’s Peripheral Nerve Blocks and Anatomy for Ultrasound-Guided Regional Anesthesia, 2nd ed. New York: McGraw-Hill, Inc; 2011.)
Doppler Mode
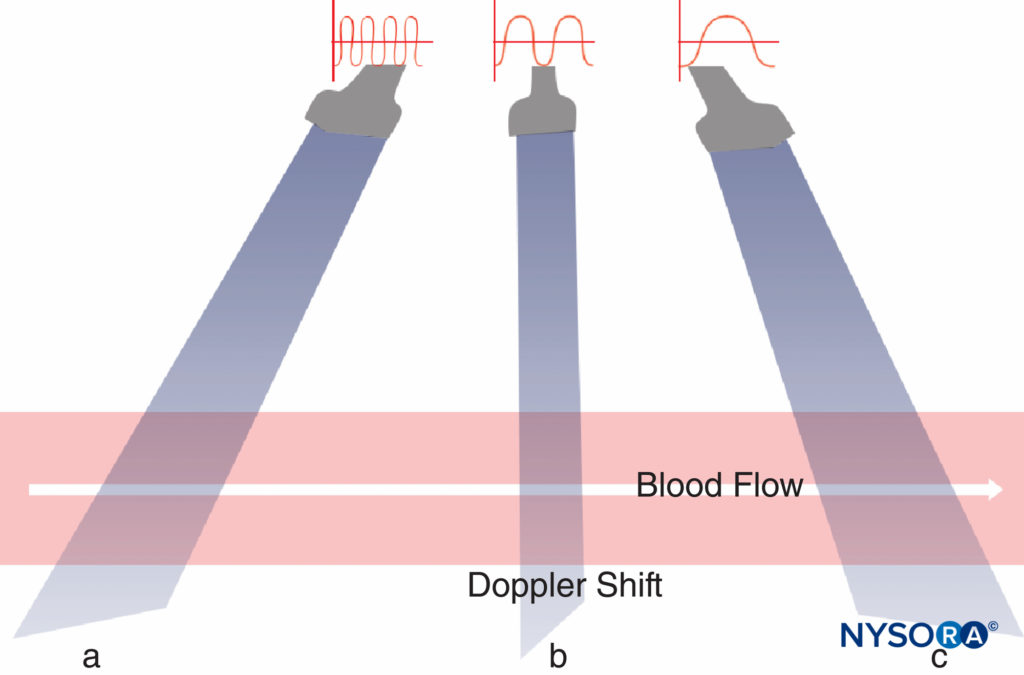
The Doppler effect is based on the work of Austrian physicist Johann Christian Doppler. The term describes a change in the frequency or wavelength of a sound wave resulting from relative motion between the sound source and the sound receiver. In other words, at a stationary position, the sound frequency is constant. If the sound source moves toward the sound receiver, the sound waves have to be squeezed, and a higher-pitch sound occurs (positive Doppler shift); if the sound source moves away from the receiver, the sound waves have to be stretched, and the received sound has a lower pitch (negative Doppler shift) (Figure 11). The magnitude of Doppler shift depends on the incident angle between the directions of emitted ultrasound beam and moving reflectors. With a 90° angle there is no Doppler shift. If the angle is 0° or 180°, the largest Doppler shift can be detected. In medical settings, the Doppler shifts usually fall in the audible range.
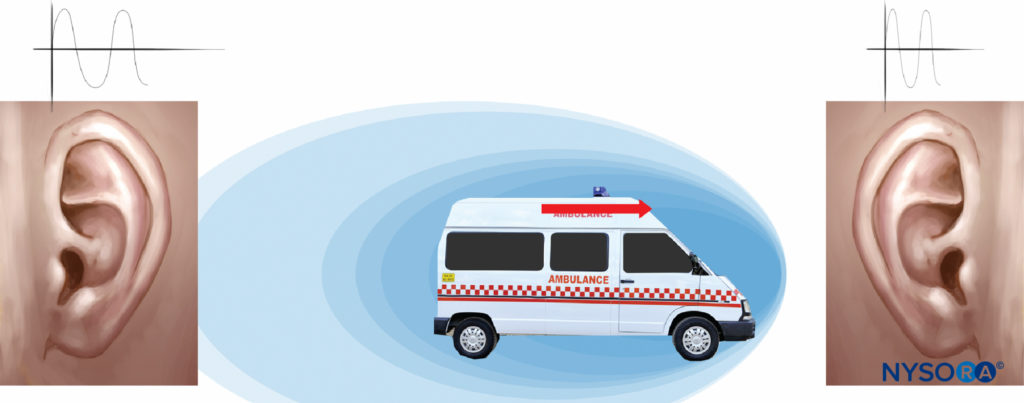
Figure 11. The Doppler effect. When a sound source moves away from the receiver, the received sound has a lower pitch and vice versa. (Adapted with permission from Hadzic A: Hadzic’s Peripheral Nerve Blocks and Anatomy for Ultrasound-Guided Regional Anesthesia, 2nd ed. New York: McGraw-Hill, Inc; 2011.)
Color Doppler produces a color-coded map of Doppler shifts superimposed onto a B-mode ultrasound image. Blood flow direction depends on whether the motion is toward or away from the transducer. Selected by convention, red and blue colors provide information about the direction and velocity of the blood flow. According to the color map (color bar) in the upper left-hand corner of the figure (Figure 12), the red color on the top of the bar denotes the flow coming toward the ultrasound probe, and the blue color on the bottom of the bar indicates the flow away from the probe.
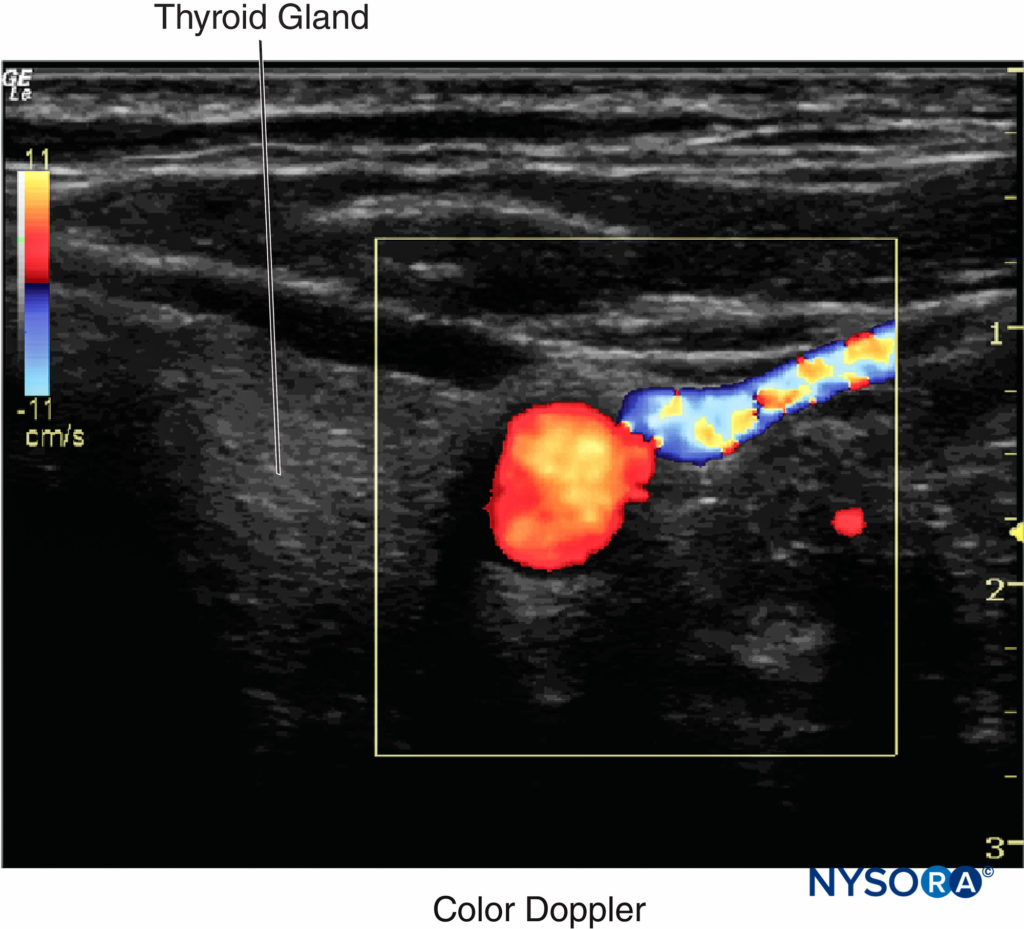
Figure 12 Color Doppler produces a color-coded map of Doppler shapes superimposed onto a B-mode ultrasound image. Selected by convention, red and blue colors provide information about the direction and velocity of the blood flow. (Adapted with permission from Hadzic A: Hadzic’s Peripheral Nerve Blocks and Anatomy for Ultrasound-Guided Regional Anesthesia, 2nd ed. New York: McGraw-Hill, Inc; 2011.)
In ultrasound-guided peripheral nerve blocks, color Doppler mode is used to detect the presence and nature of the blood vessels (artery vs. vein) in the area of interest. When the direction of the ultrasound beam changes, the color of the arterial flow switches from blue to red, or vice versa, depending on the convention used (Figures 13, 14A, 14B, and 14C). Power Doppler is up to five times more sensitive in detecting blood flow than color Doppler, and it is less dependent on the scanning angle. Thus, power Doppler can be used to identify the smaller blood vessels more reliably. The drawback is that power Doppler does not provide any information on the direction and speed of blood flow (Figure 15).
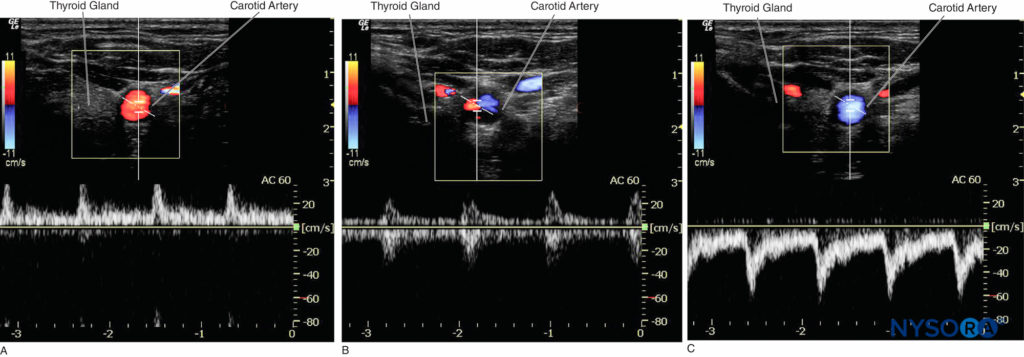
Figure 14. A: Carotid artery displays a red color when the blood flows toward the transducer. B: Carotid artery displays ambiguous color at a 90° Doppler angle; the equal waveform can be seen on both sides of the baseline. C: Carotid artery displays blue color when the blood flows away from the transducer.
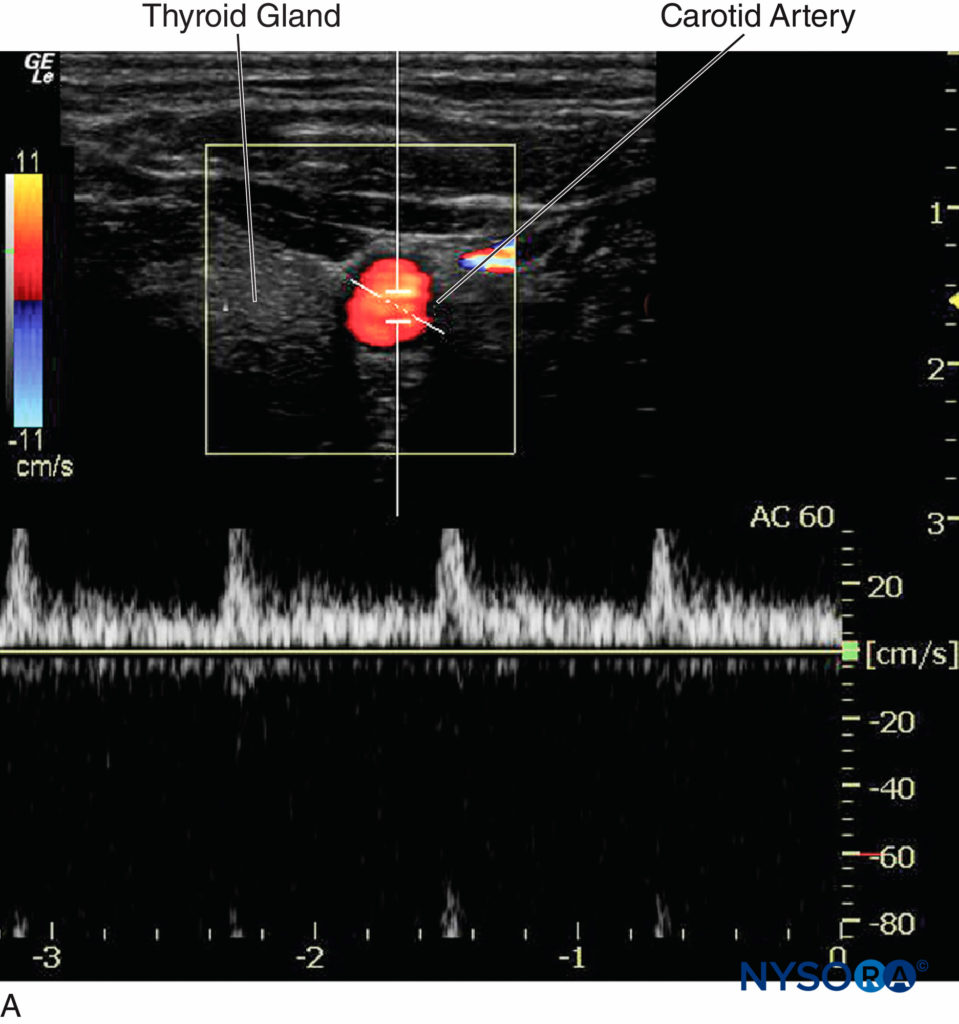
Figure 15. Although the power Doppler may be useful in identifying smaller blood vessels, the drawback is that it does not provide information on the direction and speed of blood flow. (Adapted with permission from Hadzic A: Hadzic’s Peripheral Nerve Blocks and Anatomy for Ultrasound-Guided Regional Anesthesia, 2nd ed. New York: McGraw-Hill, Inc; 2011.)
M-Mode
A single beam in an ultrasound scan can be used to produce a picture with a motion signal, where movement of a structure such as a heart valve can be depicted in a wave-like manner. M-mode is used extensively in cardiac and fetal cardiac imaging; however, its present use in regional anesthesia is negligible (Figure 16).
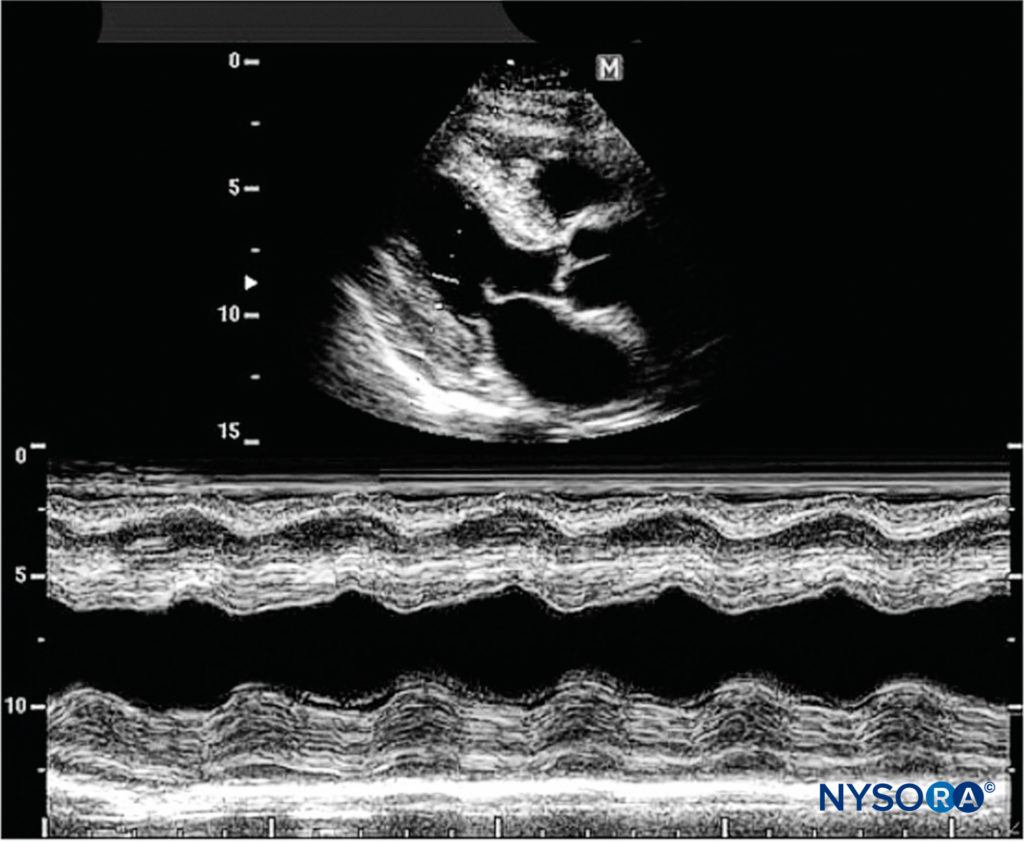
Figure 16. M-mode consists of a single beam used to produce an image with a motion signal. Movement of a structure can be depicted in a wavelike matter. (Reproduced with permission from Hadzic A: Hadzic’s Peripheral Nerve Blocks and Anatomy for Ultrasound-Guided Regional Anesthesia, 2nd ed. New York: McGraw-Hill, Inc; 2011.)
ULTRASOUND INSTRUMENTS
Ultrasound machines convert the echoes received by the transducer into visible dots, which form the anatomic image on an ultrasound screen. The brightness of each dot corresponds to the echo strength, producing what is known as a grayscale image. Two types of scan transducers are used in regional anesthesia: linear and curved. A linear transducer can produce parallel scan lines and a rectangular display, called a linear scan, whereas a curved transducer yields a curvilinear scan and an arc-shaped image (Figures 17A and 17B). In clinical scanning, even a very thin layer of air between the transducer and skin may reflect virtually all the ultrasound, hindering any penetration into the tissue. Therefore, a coupling medium, usually an aqueous gel, is applied between surfaces of the transducer and skin to eliminate the air layer.
The ultrasound machines currently used in regional anesthesia provide a 2D image, or “slice.” Machines capable of producing three-dimensional (3D) images have recently been developed. Theoretically, 3D imaging should help in understanding the relationship of anatomic structures and the spread of local anesthetics. There are three major types of 3D ultrasound imaging: (1) Freehand 3D is based on a set of 2D cross-sectional ultrasound images acquired from a sonographer sweeping the transducer over a region of interest (Figures 18A and 18B). (2) Volume 3D provides 3D volumetric images using a dedicated 3D transducer. The transducer elements automatically sweep through the region of interest during the scanning; the sonographer is not required to perform hand motions (Figure 18C). (3) Real-time 3D takes multiple images at different angles, allowing the sonographer to see the 3D model moving in real time. However, typical spatial resolution of 3D imaging is about 0.34–0.5 mm. At present, 3D imaging systems still lack the resolution and simplicity of 2D images, so their practical use in regional anesthesia is limited.
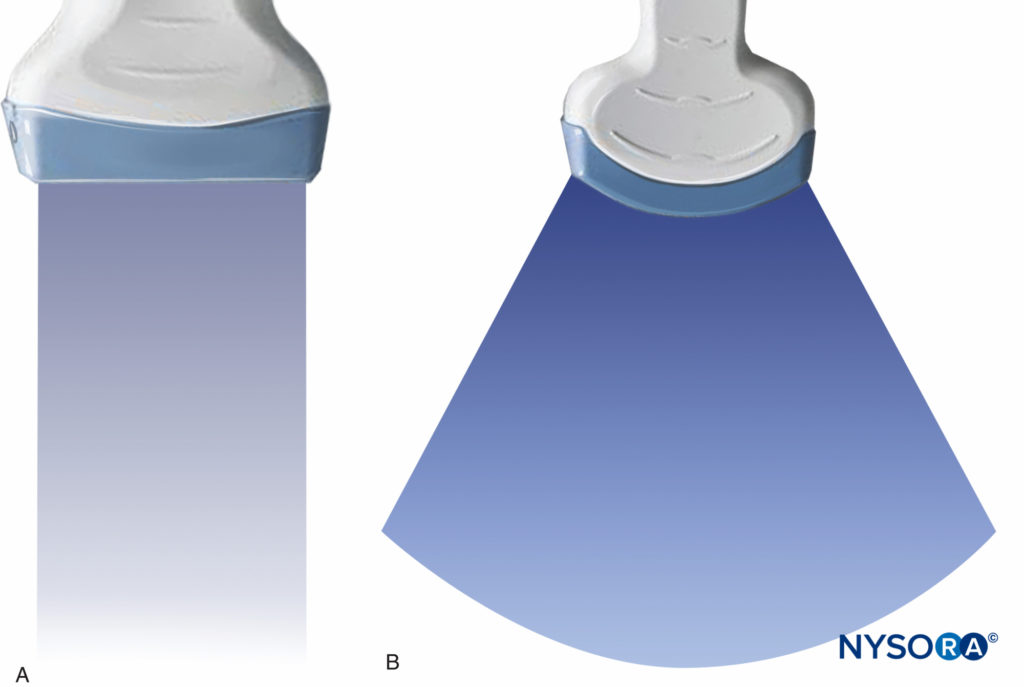
Figure 17. A: Rectangular scan field given by linear transducer. B: Arc-shaped scan field given by curved transducer. (Adapted with permission from Hadzic A: Hadzic’s Peripheral Nerve Blocks and Anatomy for Ultrasound-Guided Regional Anesthesia, 2nd ed. New York: McGraw-Hill, Inc; 2011.)

Figure 18. A: Freehand 3D imaging. A linear transducer produces parallel scan lines and a rectangular display; linear scan. B: Freehand 3D imaging. A curved “phase array” transducer results in a curvilinear scan and an arch-shaped image. C: Fetal face viewed by volume 3D imaging. (Reproduced with permission from Hadzic A: Hadzic’s Peripheral Nerve Blocks and Anatomy for Ultrasound-Guided Regional Anesthesia, 2nd ed. New York: McGraw-Hill, Inc; 2011.)
TIME-GAIN COMPENSATION
The echoes exhibit a steady decline in amplitude with increasing depth. This occurs for two reasons: First, each successive reflection removes a certain amount of energy from the pulse, decreasing the generation of later echoes. Second, tissue absorbs ultrasound, so there is a steady loss of energy as the ultrasound pulse travels through the tissues. This can be corrected by manipulating time-gain compensation (TGC) and compression functions. Gain is the ratio of output to input electric power; it controls the brightness of the image. The gain is usually measured in decibels (dB). Increasing the gain amplifies not only the returning signals, but also the background noise within the system in the same manner. TGC is a time-dependent amplification. TGC function can be used to increase the amplitude of incoming signals from various tissue depths.
The layout of the TGC controls varies from one machine to another. A popular design is a set of slider knobs. Each knob in the slider set controls the gain for a specific depth, which allows for a well-balanced gain scale on the image (Figures 19A, 19B, and 19C).

Figure 19: A, B, and C: The effect of the time-gain compensation settings. Time-gain compensation is a function that allows time- (depth) dependent amplification of signals returning from different depths. (Adapted with permission from Hadzic A: Hadzic’s Peripheral Nerve Blocks and Anatomy for Ultrasound-Guided Regional Anesthesia, 2nd ed. New York: McGraw-Hill, Inc; 2011.)
Amplification is the conversion of the small voltages received from the transducer into larger ones that are suitable for further processing and storage. There are two amplification processes considered to increase the magnitude of ultrasound echoes: linear and nonlinear amplification. Currently, the ultrasonic imaging system with linear amplifiers is commonly used in medical diagnostic applications. However, the strength of echoes attenuates exponentially as the distance between the transducer and the reflector increases. Ultrasonic imaging instruments equipped with logarithmic amplifiers can display echo signals with a wider dynamic range than a linear amplifier and remarkably improve the sensitivity for a small magnitude of echoes on the screen.
Dynamic range is the range of amplitudes from largest to the smallest echo signals that an ultrasound system can detect. The wider/higher dynamic range presents a larger number of grayscale levels, and it creates a softer image; the image with a narrower/lower dynamic range appears with more contrast (Figures 20A and 20B). Dynamic range less than 50 dB or greater than 100 dB is probably too low or too high in terms of visualization of peripheral nerve. Compression is the process of decreasing the differences between the smallest and largest echo-voltage amplitudes; the optimal compression is between 2 and 4 for a maximal scale equal to 6.

Figure 20.: A: A softer image provided by a higher dynamic range. B: An image with more contrast provided by a lower dynamic range.
FOCUSING
As previously discussed, it is common to use electronic means to narrow the width of the beam at some depth and achieve a focusing effect similar to that obtained using a convex lens (Figure 21). There are two types of focusing: annular and linear. These are illustrated in Figures 22A and 22B, respectively.
Adjusting focus improves the spatial resolution on the plane of interest because the beam width is converged. However, the reduction in beam width at the selected depth is achieved at the expense of degradation in beam width at other depths, resulting in poorer images below the focal zone.
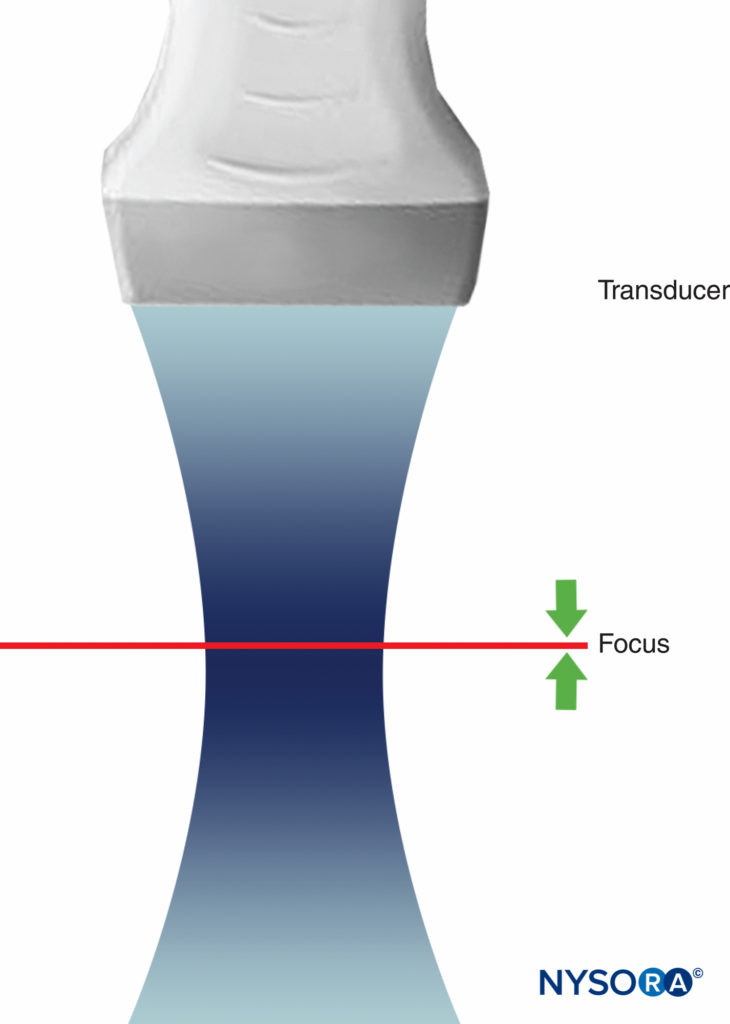
Figure 21: A demonstration of focusing effect. An electronic means can be used to narrow the width of the beam at a specific depth, resulting in the focusing effect and greater resolution at a chosen depth. (Adapted with permission from Hadzic A: Hadzic’s Peripheral Nerve Blocks and Anatomy for Ultrasound-Guided Regional Anesthesia, 2nd ed. New York: McGraw-Hill, Inc; 2011.)
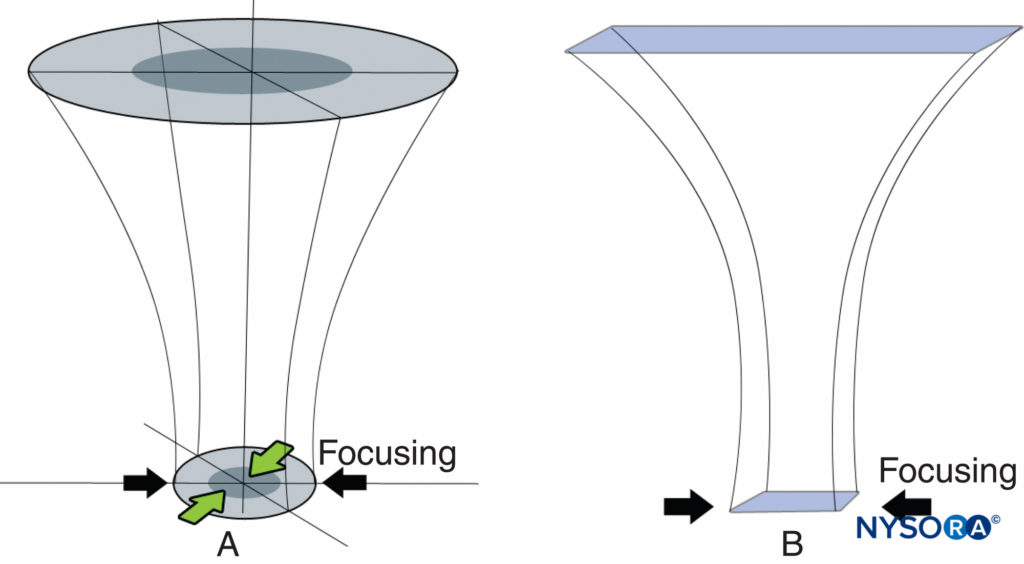
Figure 22: A: Annular focusing is electronic focusing from all directions in the scan plane given by an annular transducer that contains several ring elements arranged concentrically. B: Linear focusing is electronic focusing applied along both lateral sides in the scan plane.
BIOEFFECT AND SAFETY
The mechanisms of action by which an ultrasound application could produce a biologic effect can be conceptually categorized into two aspects: heating and mechanical. In reality, these two effects are rarely separable except for extracorporeal lithotripsy, the therapeutic application of mechanical bioeffects alone. The generation of heat increases as ultrasound intensity or frequency is increased. For similar exposure conditions, the expected temperature increase in bone is significantly greater than in soft tissues. In in vivo experiments, high-intensity ultrasound (usually > 2 W/cm2) is used to evaluate harmful biological effect; it is 5 to 20 times larger than therapeutic intensities (0.08–0.5 W/cm2) and 8 to 100 times larger than diagnostic intensities (color flow mode 0.25 W/cm2, B-mode scan 0.02 W/cm2). Reports in animal models (mice and rats) suggest that application of ultrasound may result in a number of undesired effects, such as fetal weight reduction, postpartum mortality, fetal abnormalities, tissue lesions, hind limb paralysis, blood flow stasis, and tumor regression. Other reported undesired effects in mice are abnormalities in B-cell development and ovulatory response and teratogenicity.
In general, adult tissues are more tolerant of rising temperature than fetal and neonatal tissues. A modern ultrasound machine displays two standard indices: thermal and mechanical. The thermal index (TI) is defined as the transducer acoustic output power divided by the estimated power required to raise tissue temperature by 1°C. The mechanical index (MI) is equal to the peak rarefactional pressure divided by the square root of the center frequency of the pulse bandwidth. TI and MI indicate the relative likelihood of thermal and mechanical hazard in vivo, respectively. Either TI or MI greater than 1.0 is hazardous.
The biologic effect due to ultrasound also depends on tissue exposure time. The researchers usually use pregnant mice to expose to ultrasound with a minimum intensity of 1 W/cm2 for 60 to 420 minutes to evaluate the time-dependent adverse events that happen in rodent fetuses. Fortunately, ultrasound-guided nerve block requires the use of only low TI and MI values on the patient for a short period of time. Based on in vitro and in vivo experimental study results to date, there is no evidence that the use of diagnostic ultrasound in routine clinical practice is associated with any biologic risks.
REFERENCES
- Curie J, Curie P: Développement par pression de l’é’lectricite polaire dans les cristaux hémièdres à faces inclinées. CR Acad Sci (Paris) 1880;91:294.
- Langevin P: French Patent No. 505,703. Filed September 17, 1917. Issued August 5, 1920.
- Thompson J: Unrestricted U-boat warfare: The Royal Navy nearly loses the war. In Imperial War Museum Book of the War at Sea 1914–18. Pan Books, 2006, Chapter 10.
- Langévin MP: Lés ondes ultrasonores. Rev Gen Elect 1928;23:626.
- Ensminger D, Bond LJ: Ultrasonics: Fundamentals, Technologies, and Applications, 3rd ed. Francis Group, 2012.
- Dussik KT: On the possibility of using ultrasound waves as a diagnostic aid. Neurol Psychiat 1942;174:153–168.
- Dussik KT, Dussik F, Wyt L. Auf dem Wege Zur Hyperphonographie des Gehirnes. Med Wochenschr 1947;97:425–429.
- Kossoff G, Robinson DE, Garrett WJ: Ultrasonic two-dimensional visualization techniques. IEEE Trans Sonics Ultrason 1965;SU12:31–37
- Thompson HE, Holmes JH, Gottesfeld KR, Taylor ES: Fetal development as determined by ultrasound pulse-echo techniques. Am J Obstet Gynecol 1965;92:44–53.
- US federal trademark registration filed for ECHO-DOPPLER by Advanced Technology Laboratories Inc. Ultrasound apparatus for diagnostic medicine. Trademark serial number 73085203. April 26, 1976.
- La Grange PDP, Foster PA, Pretorius LK: Application of the Doppler ultrasound blood flow detector in supraclavicular brachial plexus block. Br J Anesth 1978;50:965–967.
- Ting PL, Sivagnanaratnam V: Ultrasonographic study of the spread of local anaesthetic during axillary brachial plexus block. Br J Anesth 1978; 63:326–329.
- Kapral S, Krafft P, Eibenberger K, Fitzgerald R, Gosch M, Weinstabl C: Ultrasound-guided supraclavicular approach for regional anesthesia of the brachial plexus. Anesth Analg 1994;78:507–513.
- Sokolov SY, inventor: Means for indicating flaws in materials. United States patent 2164125. 1937.
- White DN: Johann Christian Doppler and his effect—A brief history. Ultrasound Med Biol 1982;8(6):583–591.
- O’Brien WD Jr. Biological effects in laboratory animals. In Biological Effects of Ultrasound. Churchill Livingstone, 1985, 77–84.
- Kerry BG, Robertson VJ, Duck FA: A review of therapeutic ultrasound: Biophysical effects. Phys Ther 2001;81:1351–1358.
- American Institute of Ultrasound in Medicine, National Electrical Manufacturers Association: Standard for Real-Time Display of Thermal and Mechanical Acoustic Output Indices on Diagnostic Ultrasound Equipment, Revision 2. American Institute of Ultrasound in Medicine and National Electrical Manufacturers Association, 2004.
- British Medical Ultrasound Society: Guidelines for the safe use of diagnostic ultrasound equipment. Ultrasound 2010 May 18:52–59.
- Ang ES Jr, Gluncic V, Duque A, Schafer ME, Rakic P: Prenatal exposure to ultrasound waves impacts neuronal migration in mice. Proc Natl Acad Sci U S A 2006;103(34):12903–12910.
