1. HISTOLOGIC CONSIDERATIONS
On the whole, skeletal muscles can be regarded as the largest organ of the human body, accounting for approximately 25–35% of the total body weight in women and 40–50% in men (Hollman and Hettiger 1990). They are made up of two components: the muscle fibers, which are long and cylindrical in structure, representing the cellular unit of muscle, and stromal connective tissue. Individual muscle fibers are grouped together in bundles, which are commonly known as fascicles, and several fascicles join together to form an individual muscle (Fig. 1a). Thin connective tissue strands he endomysium – separate the individual muscle fibers; a more substantial connective sheath with small vessels and nerve endings, the perimysium (also referred to as fibroadipose septa), envelops individual fascicles; a thick fibrous layer, the epimysium, surrounds the entire muscle (Fig. 1a). Muscle fibers vary in length and cross-sectional diameter depending on the individual muscle. Fascicles may be either coarse, as in the case of large muscles, or very fine, as in the case of small muscles that coordinate precise movement (Erickson 1997). They insert into the different connective tissue components of the muscle, including the peripheral epimysium and central major septa formed by converging fibroadipose septa. At their distal end, intramuscular septa join into large tendinous layers – commonly referred to as aponeuroses – or directly to tendons.
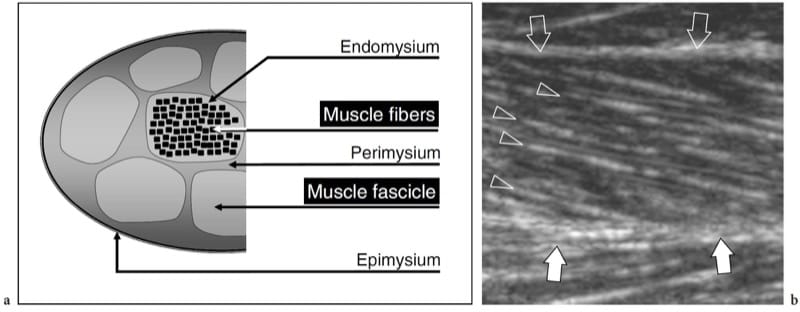
Figure 1. a,b. Skeletal muscle anatomy. a Schematic drawing illustrates the histologic organization of muscle tissue. Individual muscle fibers are arranged in fascicles. Loose connective tissue strands envelope the fibers (endomysium), the fascicles (perimysium) and the whole muscle (epimysium). b Long-axis 12.5 MHz US image of the medial head of gastrocnemius shows innumerable hyperechoic lines (arrowheads) consistent with perimysium. Note the oblique course of these echoes as they converge toward the aponeurosis (white arrows). The epimysium (open arrows) demarcates the outer boundaries of the muscle.
The internal arrangement of the muscle varies according on the fascicular orientation, which reflects gross muscle shape and function. A parallel arrangement is found in strap-like (e.g., sartorius) and quadrilateral (e.g., thyrohyoid) muscles, in which fibers course nearly the full length of the long axis of the muscle; the rectus abdominis shows a similar arrangement, but the course of the fibers is interrupted by transversely oriented tendinous intersections (Erickson 1997). Fascicles of fusiform muscles have parallel orientation in the midportion, but they converge toward the tendon at the muscle ends (Fig. 2a). An oblique fascicular (feather-like) arrangement relative to the line of traction characterizes pennate muscles (Fig. 2b,c). From the biomechanical point of view, the architecture of these muscles increases the insertion surface of fascicles in order to produce a higher force for a given muscle weight. Pennate muscles include triangular-shaped (e.g., adductor longus), unipennate or semipennate (e.g., flexor pollicis longus), bipennate (e.g., rectus femoris), multipennate (e.g., deltoid), and circumpennate (e.g., tibialis anterior) muscles (Erickson 1997). In bipennate muscles, fascicles converge into a single central tendon, whereas multipennate muscles exhibit more than one tendon coursing through the muscle substance. Fascicles may also assume a spiral arrangement in muscles that curve or have a spiral course between the origin and the insertion (e.g., pectoralis major, supinator). In addition, muscles are composed of a single belly or may have a complex internal architecture made up of multiple heads with a different origin (e.g., two heads for the biceps brachii and the biceps femoris; three heads for the triceps brachii and the triceps surae) and join together to generate a distal tendon. From the histologic point of view, muscle fibers can be divided in type 1 (red fibers) and type 2 (white fibers), which have a different structure, metabolic and functional behavior. Type 1 fibers, which are also referred to as slow-twitch fibers, have a smaller diameter, more blood vessels and myoglobin, and are better suited for slow but prolonged contractions. Type 2 fibers, which are also known as fast-twitch fibers, are larger in size, have fewer blood vessels and a lower myoglobin content, and are capable of powerful contractions of short-duration. Each muscle is made up of a mixture of both fiber types: in some muscles, type 2 fibers are predominant (medial head of gastrocnemius); in others, type 1 fibers are the leading component (soleus muscle).
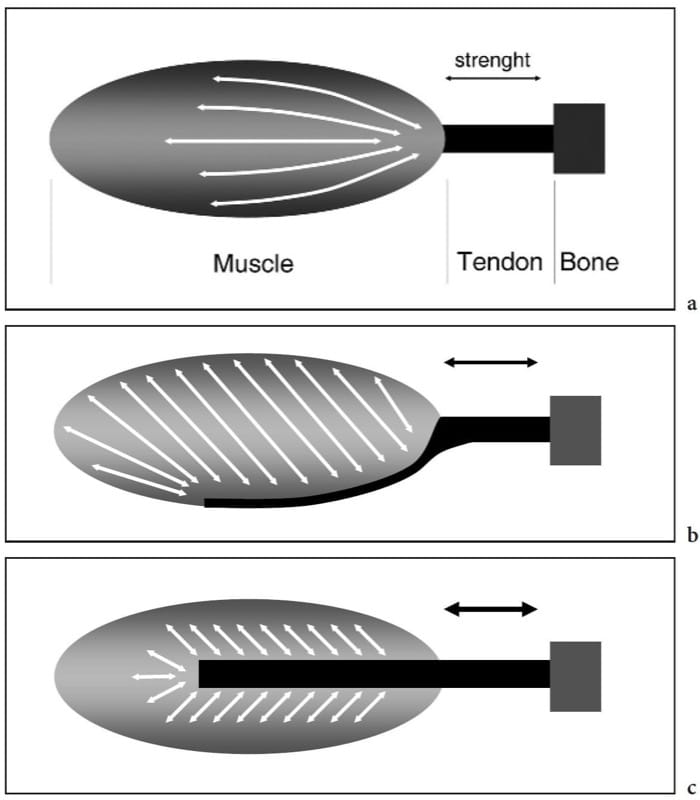
Figure 2. a–c. Skeletal muscle anatomy. Schematic drawings demonstrate the internal architecture of skeletal muscles. a Fusiform muscle. The fascicles have a parallel arrangement in the mid-portion of the muscle and converge distally toward the tendon. This leads to a high range of shortening and great movement velocity but results in a low strength. b Unipennate muscle. The fascicles are arranged at an angle to the direction in which the tendon moves and are inserted on one side of the aponeurosis. This results in a greater area of muscle fibers along the axis of contraction and produces more strength at the expense of a reduced range of shortening. c Bipennate muscle. The fascicles insert on two sides of a central aponeurosis. This arrangement produces the highest strength but the lower shortening of the muscle. From the biomechanical point of view, the amount of force that a muscle can generate is proportional to the area of muscle fibers multiplied by the cosine of the muscle-tendon angle.
During muscle contraction, the force is transmitted to the skeleton by the tendon or aponeurosis and may or may not result in joint motion. There are three different types of muscle contraction: isometric, when the muscle contracts but there is no change in its length (Fig. 3a,d); isotonic, when the muscle contracts and simultaneously shortens (Fig. 3b,e); and eccentric, when the muscle contracts and, at the same time, lengthens (Fig. 3c,f).
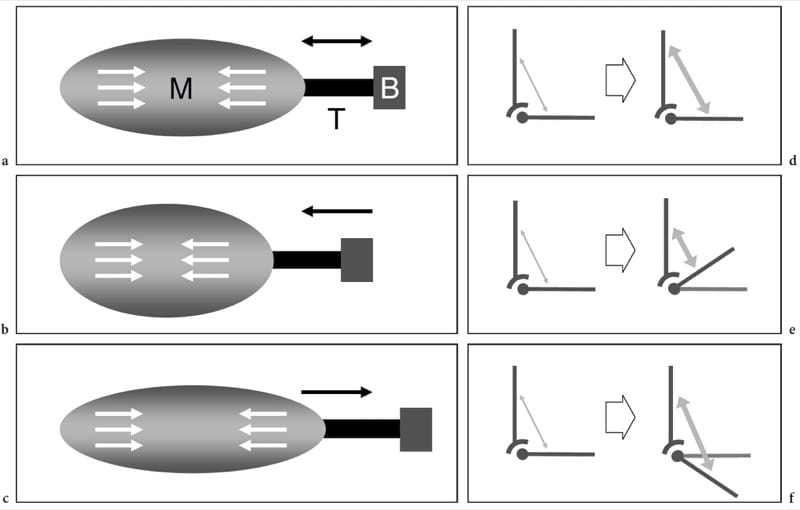
Figure 3. a-f Muscle biomechanics. a–c Schematic drawings of the muscle (M) – tendon (T) – bone (B) unit with d–f corresponding vector force diagrams illustrate the main types of muscle contraction. White arrows within the muscles and gray arrows in the diagrams indicate contraction. a,d Isometric contraction. The length of the muscle remains the same when it generates tension (arrows) to the tendon. This type of contraction is also referred to as a static contraction and an example is attempting to lift an immovable object or holding a weight at arm’s length. b,e Isotonic contraction. The muscle shortens as it contracts.
Many activities involve this type of contraction. An example of isotonic contraction is flexing the biceps muscle to lift an object. c,f Eccentric contraction. This contraction is the opposite of the isotonic. The muscle lengthens as it gains tension (arrows) and the load is very high. An example is walking downstairs or landing on the ground from a jump.
2. NORMAL US ANATOMY AND SCANNING TECHNIQUE
When examining muscles, the choice of the appropriate transducer and US frequency band depends on a variety of factors, including the overall size of the muscle belly, its position relative to the skin surface (deep or superficial), and the conspicuity of subcutaneous tissue and intervening soft-tissue planes. For an adequate examination, hand muscles require small-sized probes working at high frequencies (frequency band 7–15 MHz), whereas large, deep muscles of the thigh or buttock can be best assessed by means of low-frequency probes (frequency band 3.5–10 MHz). Multiple focal zones should be selected and adjusted to the appropriate depth in order to improve the resolution capabilities over the region of interest. Extended-field-of-view technology greatly increases the ability of US to represent wide and long muscles in a single image as well as to measure the size of large intramuscular lesions, such as hematomas and tumors (Barberie et al. 1998).
The patient should be examined in a comfortable position during complete relaxation, isometric and isotonic contraction. Before starting the examination, some notes on the patient’s clinical history should be collected by the examiner with special reference to previous sport trauma (date and mechanism of the injury). Inspection of the affected body area is also needed to rule out local swelling and ecchymosis; then, palpation of the muscle may reveal local tenderness and a mass effect. Especially in a traumatic setting, an accurate location of the referred pain may help to make the US examination more focused and to shorten the examination time. Then, US scanning is performed by means of long- and short-axis image planes over the affected muscle at rest and during repeated muscle activations. When examining deep muscles, probe compression may help to reduce the thickness of the overlying soft-tissue structures thus making US assessment easier. In patients with muscle hernia, excessive probe pressure may lead to its partial or complete reduction, making the diagnosis difficult. In these cases, the use of generous amount of gel and appropriate patient positioning (i.e. squatting for hemias located in the anterolateral compartment of the leg) to increase the intrafascial pressure may enhance the conspicuousness of the hernia. The size of muscles can be readily assessed with US by means of cross-sectional scanning planes. As measured by dynamometry, differences in muscle size correlate with muscle force (maximal isometric contractions) in both healthy subjects and patients with myositis (Chi-Fishman et al. 2004). Physiologic muscle hypotrophy or hypertrophy can be easily assessed on short-axis US planes: during these measurements, care should be taken, however, to avoid any pressure with the probe that can alter the accuracy of measurements and the comparison with the contralateral muscle. Overall, US can be considered a valuable alternative to MR imaging to evaluate the cross-sectional area of muscles and is able to provide information on its changes in response to training or disuse (Reeves et al. 2004).
The echotexture of normal skeletal muscles consists of a relatively hypoechoic background reflecting muscle fascicles and clearly demarcated linear hyperechoic strands related to fibroadipose septa (perimysium). The intramuscular tendons and aponeuroses appear as hyperechoic bands which are usually better assessed on short-axis images of the muscle (Fig. 4). The ratio between the hypoechoic and the hyperechoic components of muscle reflects the proportion between connective tissue and muscle fascicles. It is variable and differs among muscles – for example, the triceps brachii is less echogenic than the biceps brachii (Walker et al. 2004). The internal pattern of fibroadipose septa displays changes with age (Binzoni et al. 2001). On short-axis scans, the muscle echotexture consists of small dot-like reflectors representing fibroadipose septa interspersed among hypoechoic muscle fascicles (Fig. 5a). Although to a lesser extent than in tendons, the ordered structure of fascicles and fibroadipose septa renders muscles anisotropic structures, particularly when examined on short-axis planes (Fig. 5a,b). The angle between the US beam and the muscle is critical: an angle that deviates from perpendicular causes the muscle to appear artifactually hypoechoic. On long-axis images, fibroadipose septa appear as straight hyperechoic lines presenting a grossly parallel arrangement. Echoes from fibroadipose septa are less uniform and reflective than those observed in tendons. Depending on the arrangement of muscle fibres and fibroadipose septa, US is able to recognize the internal architecture of pennate muscles as semipennate, unipennate, bipennate, or multipennate (Fig. 6). Intramuscular vessels coursing within the hyperechoic septa are visible on color and power Doppler imaging. The outer muscle fascia (epimysium) appears as a well-delineated echogenic envelope circumscribing the hypoechoic muscle. Large hyperechoic septa (aponeuroses) directed within the muscle belly can be seen arising from it. In complex muscles, an individual hyperechoic fascial sheath surrounds each muscle belly thus helping the examiner to recognize the different heads. The interstice between juxtaposed fasciae of two adjacent muscles appears as a hypoechoic band and corresponds to loose connective tissue that allows some sliding of the muscles during contraction. Focal interruptions of the muscle fascia are found at the points where nerves, veins, and arteries (perforating vessels) enter the muscles. When the muscle fascia lies under the subcutaneous tissue, it adheres to the superficial fascia and cannot be distinguished from it.
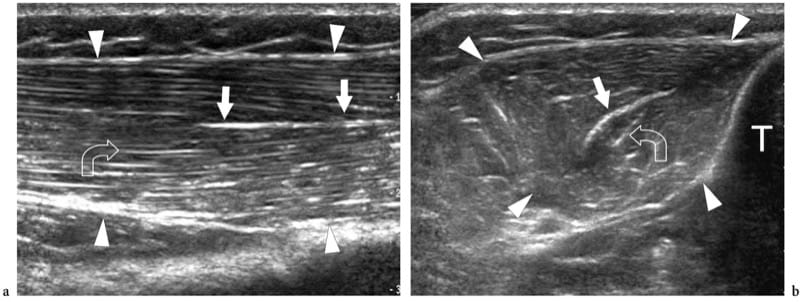
Figure 4. a,b. Intramuscular aponeuroses. a Long-axis and b short-axis 12–5 MHz US images of the normal tibialis anterior muscle (arrowheads) demonstrate the feather-like arrangement of a circumpennate muscle created by the convergence of the fibroadipose septa upon the internal aponeurosis. The aponeurosis (straight arrows) appears as a highly reflective linear echo within the muscle that is thicker than the fibroadipose septa (curved arrow). T, tibia.

Figure 5. a,b. Muscle anisotropy. Short-axis 17–5 MHz US images of the biceps brachii muscle (arrows) examined with a perpendicular angle between the transducer face and the orientation of the muscle fibers and b an angle that deviates slightly from the perpendicular. In a, the muscle appears diffusely hyperechoic owing to the highest specular reflectivity from the perimysium interfaces. In b, the overall muscle becomes more hypoechoic with decreased intensity of echoes from the perimysium. On the other hand, the larger fibroadipose septa (arrowhead) are more visible. Tilting the probe over the muscle may be useful to distinguish artifactual hypoechoic patterns from mild strains.

Figure 6. a,b. Internal architecture of skeletal muscles. a Fusiform muscle. Long-axis 12–5 MHz US image over the deltoid muscle (arrows) demonstrates the fibroadipose septa (arrowheads) as hyperechoic lines separating the hypoechoic muscle bundles. These septa have a parallel arrangement along the muscle belly. b Pennate muscle. Long-axis 125 MHz US image over the tibialis anterior muscle (arrows) demonstrates the fibroadipose septa (arrowheads) as they converge on the highly reflective aponeurosis (curved arrow), giving the appearance of a feather.
Dynamic US scanning performed during muscle contraction can show changes in size and relationship of fascicles and fibroadipose septa. On short-axis planes, contracted muscles usually appear thicker and more hypoechoic. Intramuscular septa change their appearance and orientation as a result of the action of the muscle fibers that attach into these structures. In the medial head of gastrocnemius, for instance, pennation angle increases from 15.5° to 33.6° when examined during isometric contraction (Fig. 7) (Narici et al. 1996). Shortening of muscles is well appreciated on long-axis images during concentric contraction. Recently, a method to measure muscle tissue perfusion by means of contrast-enhanced power Doppler US has been developed with quantification of intramuscular blood flow performed at rest and after exercise (Krix et al. 2005).
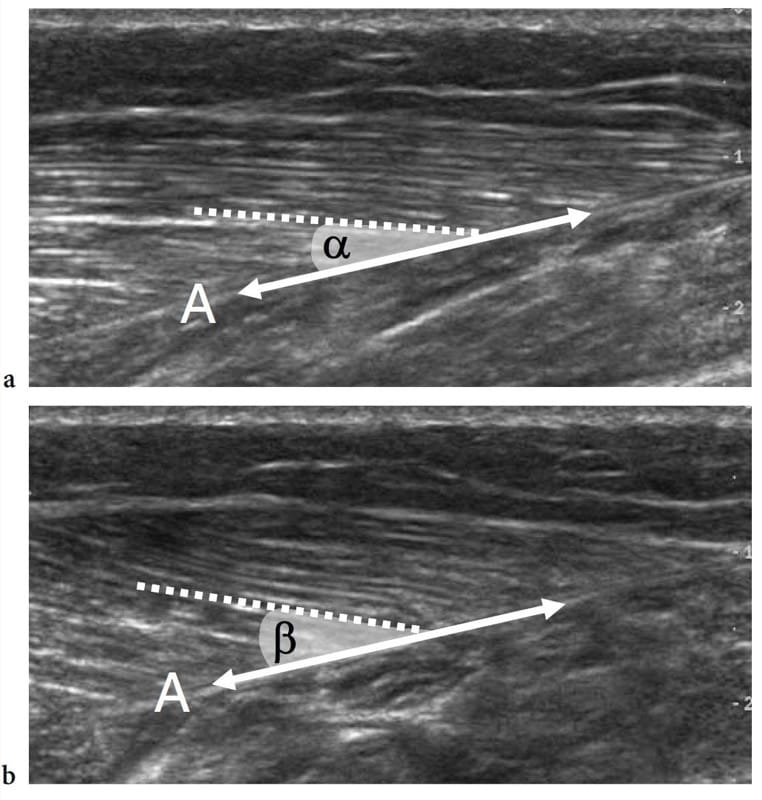
Figure 7. a,b. Pennation angle. Long-axis 12–5 MHz US images of the medial head of gastrocnemius obtained a at rest and b during isometric contraction demonstrate an increased pennation angle during muscle activation. The pennation angle is given by the incidence of the muscle fibers (dashed line) relative to the aponeurosis (A), which represents the direction of force generation (double arrow). Note that this angle is greater during contraction (β) than at rest (α).
3. ANATOMICAL VARIANTS AND HERITABLE DISORDERS
Muscle Agenesis, Anomalous and Accessory Muscles
Muscle agenesis indicates the absence of one muscle or one head of a complex muscle as a result of incomplete or imperfect development. In general, the diagnosis is already evident at physical examination. US examination can be required to confirm the clinical findings (Fig. 8). An accurate scanning technique is usually needed to differentiate true aplasia from marked hypoplasia or muscle atrophy. The pectoralis major and the pectoralis minor muscles are the most common congenitally absent muscles in humans.
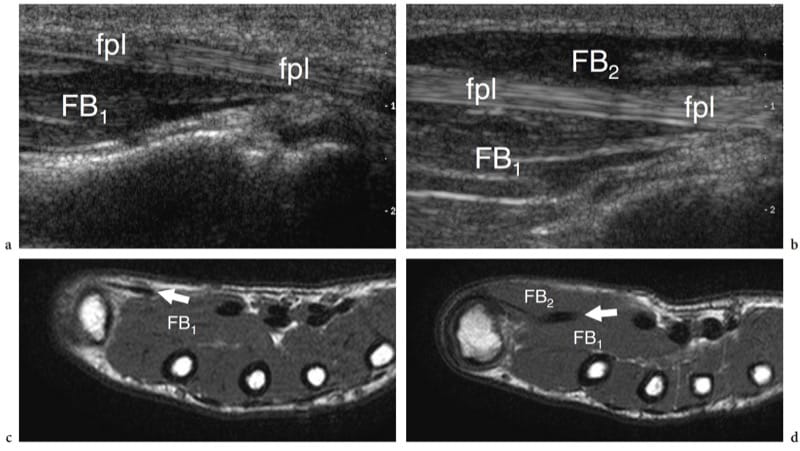
Figure 8. a–d. Muscle agenesis. Long-axis 12-5 MHz US images over the a left and b right flexor pollicis longus tendon (fpl) in an 8-year-old child with chronic loss of bulk of the left thenar eminence show congenital absence of the superficial belly (FB2) of the flexor pollicis brevis and the abductor pollicis brevis muscles. On the affected side, the flexor pollicis longus tendon assumes a more superficial course given the absence of the muscle. Note the intact deep belly of the flexor pollicis brevis (FB1). c,d Correlative T1-weighted MR images demonstrate the relationship between the flexor pollicis longus tendon (fpl) and the bellies of the flexor pollicis brevis. US is helpful in distinguishing true agenesis from marked hypoplasia or muscle atrophy
Both anomalous and accessory muscles are not uncommon developmental abnormalities (Yu and Resnick 1994; Zeiss and Guilluiam-Hadet 1996; Harvie et al. 2004; Kouvalchouk and Fisher 1998). We can define variants of normal muscle anatomy as “anomalous muscles,” and supernumerary muscles that are usually not present as “accessory muscles.” In most cases, anomalous and accessory muscles are unnoticed by the patient because they are invisible and asymptomatic. In some instances, however, they may become clinically relevant. This can occur: when they are apparent on the skin surface mimicking a soft-tissue neoplasm, e.g., reversed palmaris at wrist (Paul et al. 1991; Bianchi et al. 1995b); when they grow within osteofibrous tunnels causing nerve entrapment symptoms, e.g., accessory flexor digitorum longus and tarsal tunnel syndrome (Pla et al. 1996; Sammarco and Stephens 1990); or when they cause pain during physical exercise, e.g, accessory soleus) due to ischemia related to increased intrafascial pressure or overuse tendinopathy (Peterson et al. 1993). The diagnosis of an anomalous/accessory muscle relies mainly on recognition of its typical location and on imaging features. US demonstrates anomalous/accessory muscles as well-circumscribed elongated structures with the typical echotextural pattern of normal muscles (Montet et al. 2002). A small tendon can be found at the muscle end. Dynamic examination discloses a normal contraction pattern. During muscle activation, short-axis images show increased size and decreased echogenicity of the muscle belly owing to muscle fiber shortening. The most common accessory muscles in the upper and lower limb that are amenable to US examination are: the chondroepitrochlearis at the arm, the anconeus epitrochlearis at the elbow (Masear et al. 1988); the anomalous palmaris longus (Schuurman and van Gils 2000) and Gantzer (al-Qattan 1996) muscles at the forearm; the proximal origin of the lumbrical muscles (Timins 1999), the anomalous muscle belly of the flexor digitorum superficialis of the index finger (Martinoli et al. 2000a), the abductor digiti minimi (Harvie et al. 2003, 2004) and the extensor digitorum brevis manus (Rodriguez-Niedenfuhr et al. 2002) at the wrist and hand; the tensor fasciae suralis at the knee (Montet et al. 2002); and the accessory soleus (Bianchi et al. 1995b), the peroneus quartus (Chepuri et al. 2001), and the accessory flexor digitorum longus (Cheung et al. 1999) at the ankle (Fig. 9). Familiarity with their most frequent locations and knowledge of the possible clinical syndromes produced by these muscles are the mainstays of a correct imaging diagnosis, thus avoiding confusion with other pathologic conditions and unnecessary surgery. In doubtful cases, US examination of the contralateral side can enhance the confidence of the examiner that an anomalous/accessory muscle is present.
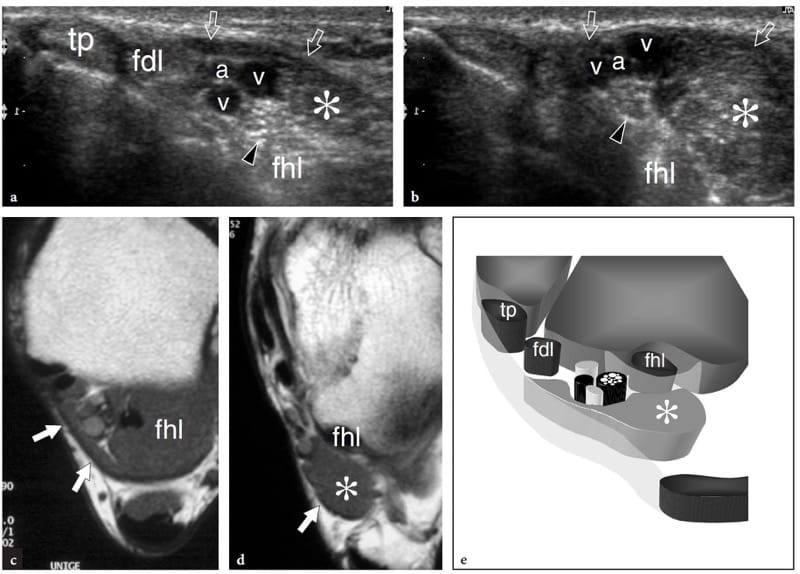
Figure 9. a–e. Accessory ankle muscle. a,b Transverse 12-5 MHz US images over the a proximal and b distal medial ankle with c,d T1-weighted MR imaging correlation in a patient with tingling on the medial aspect of the foot extending into the hallux and second toes. US images reveal the anatomic structures contained in the tarsal tunnel, including the tibialis posterior (tp), the flexor digitorum longus (fdl), and the flexor hallucis longus (fhl) tendons, the tibial nerve (arrowhead), and the tibial artery (a) and veins (v). An accessory muscle (asterisk) is found inside the tunnel. This muscle is wedged between the flexor hallucis longus and the flexor retinaculum (arrows), posterior to the neurovascular bundle and refers to the accessory flexor digitorum longus. In this particular case, the accessory muscle caused mild compressive tibial neuropathy. e Schematic drawing through the posteromedial ankle illustrates the relationship of the accessory flexor digitorum longus with the other structures housed in the tarsal tunnel. In most cases, this accessory muscle arises from the posterior aspect of the tibia and the interosseous membrane, running inside the tarsal tunnel to insert into the quadratus plantae or the flexor digitorum longus muscle.
4. NEUROMUSCULAR DISORDERS
In neuromuscular disorders, such as Duchenne and Becker muscular dystrophies, spinal muscle atrophy, and other congenital myopathies, the histologic architecture of muscles is disrupted by muscle cell replacement with connective tissue and fat. This causes profound US changes in muscle architecture with increased echogenicity, loss of heterogeneity, and shadowing (Fig. 10). The increased echogenicity of muscle reflects an increased number of acoustic interfaces related to fat accumulation, fibrosis, and inflammation. In neuromuscular disorders, the increased reflectivity of muscles is associated with a decreased ability of the US beam to penetrate deeper structures, leading to loss of bone edge definition and bone shadowing (Fischer et al. 1998; Walker et al. 2004). In addition, the disease process blurs the distinction between fibroadipose septa and muscle fascicles, making the image more homogeneously echogenic (Fig. 10a).
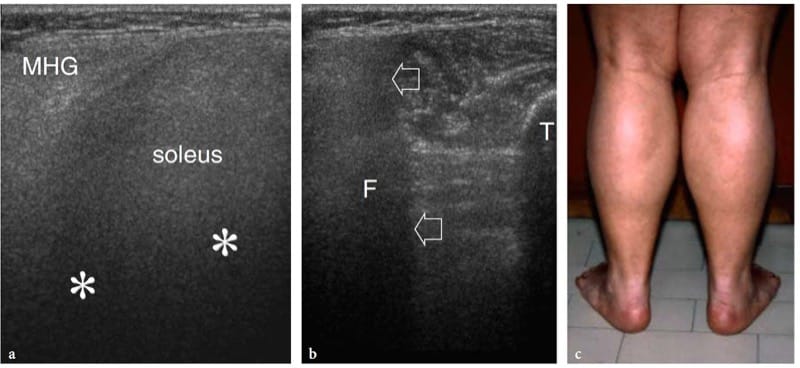
Figure 10. a–c. Neuromuscular disorders. a,b Transverse 12-5 MHz US images obtained over the a posteromedial and b posterolateral aspect of the middle third of the leg in a 12-year-old child with Duchenne dystrophy. The affected medial head of the gastrocnemius (MHG) and soleus exhibits a diffusely hyperechoic pattern with strong US beam attenuation (asterisks) and blurred distinction of fibroadipose septa. The acoustic shadowing leads to inability of the US beam to penetrate deep structures. In b, there is loss of bone edge definition of the fi bula (F) caused by the abnormal muscle reflectivity (arrows). T, tibia. c Photograph showing calf muscle pseudohypertrophy. The patient had progressive symmetric muscle weakness associated with elevated serum CK levels, myalgia, cramps, and stiffness after exercise.
Similarly, peripheral neuropathies are often associated with selective atrophy of the innervated muscles. US is able to evaluate the size and echotexture of the affected muscles by comparing the two extremities (Scholten et al. 2003). A definite loss in bulk of the affected muscle would suggest atrophy. This can be appreciated by simple pattern recognition analysis (concave or straight muscle boundaries instead of the normal convex surface). Because side-to-side differences in muscle thickness rarely exceed 20%, measuring the muscle diameters or cross-sectional area with the electronic calipers of the equipment seems to be a more reliable means to assess volume changes in a given group of muscles than subjective evaluation (Bargfrede et al. 1999). The ratio of muscle thickness to subcutaneous fat thickness was found to be helpful in specific neuromuscular disorders (decreased ratio in spinal muscle atrophy). In neuromuscular disorders, however, US has shown some limitations compared with MR imaging. The complex distribution of muscle involvement in some dystrophies seems more reliably mapped with MR imaging because of its better anatomic rendering and panoramic view. Based on echotextural pattern analysis, US is not as accurate as MR imaging in distinguishing early neurogenic atrophy (in which changes are mainly related to extracellular edema) from late atrophy (in which muscle tissue is gradually replaced by fat). Unlike MR imaging, in which early denervation is appreciated by a homogeneous hyperintense pattern on T2-weighted and STIR sequences (increase in free-water content) and late denervation by a hyperintense pattern on T1-weighted images (fatty replacement), at US the two processes have a similar hyperechoic pattern and can be hardly differentiated (Fig. 11) (Kullmer et al. 1998). Quantification of muscle echotexture to estimate the severity of atrophy would reduce the observer variability but is strongly influenced by the scanner and the equipment settings (Bargfrede et al. 1999; Pillen et al. 2003; Scholten et al. 2003). Apart from the above limitations, US can be considered a useful tool complementary to electrophysiology to provide information on muscle morphology, which is beyond the scope of electrodiagnosis.
In patients with unilateral disorders, US images of the affected muscle can be compared with those of the unaffected side. In these cases, careful positioning of the transducer by surface landmarks is needed to ensure symmetric imaging. Transverse images are best suited for muscle measurements. In patients with bilateral disorders, comparative US evaluation should be conducted by selecting a control muscle in a healthy area, possibly with similar degrees of overlying subcutaneous tissue. Finally, when examining an atrophied fatty-infiltrated muscle, the examiner must be aware that changes may occur not only as a result of a denervation process but also following disuse or a complete tendon tear (Yao and Metha 2003). Then the integrity of the tendon belonging to the affected muscle must be carefully assessed.
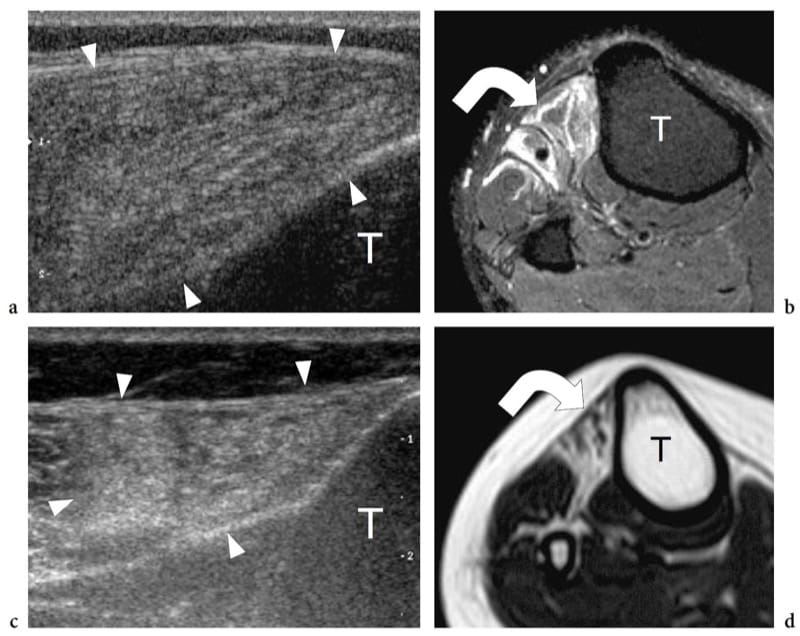
Figure 11. a–d. Neurogenic atrophy of muscles in two different patients with a,b recent-onset and c,d long-standing peroneal neuropathy. a Transverse 12–5 MHz US image over the tibialis anterior muscle with b fat-suppressed T2-weighted MR imaging correlation demonstrates normal volume and diffusely hyperechoic appearance of the muscle (arrowheads). The abnormal echotexture is related to intramuscular edema (curved arrow). c Transverse 12-5 MHz US image over the tibialis anterior muscle with d T1-weighted MR imaging correlation reveals decreased volume and hyperechoic appearance of the muscle (arrowheads). Although similar to that seen in a, the abnormal echotexture reflects fatty atrophy (curved arrow). T, tibia.
5. TRAUMATIC LESIONS
Based on their pathomechanism, muscle injuries can be grouped into two main classes: extrinsic and intrinsic. Extrinsic injuries result from external trauma, either a contusion or a penetrating injury (laceration), whereas intrinsic injuries are most often the result of contraction and simultaneous elongation of a given muscle. In the first class, the location of the tear strictly matches the site of the trauma. These lesions typically occur in areas where the muscle is compressed between the applied outer force (direct blow) and an underlying hard bony surface (e.g., quadriceps muscles against the femoral shaft). On the other hand, intrinsic ruptures almost invariably lead to a disruption of muscle fibers near the myotendinous junction, which is considered the weakest ring of the muscle-tendon-bone unit because it has less capacity for energy absorption than the other structures (Palmer et al. 1999). The myotendinous junction is the most common site of partial or complete muscle injury (Garret 1990). In fact, muscle fibers do not tear just at the myotendinous junction, but rather at a short distance from it (Noonan and Garrett 1999). In the acute phase, the injury is characterized by disruption of the muscle fibers and hemorrhage. The onset of edematous changes and inflammatory infiltrates become obvious by 48 hours after trauma. After a week, fibrous tissue begins to replace the inflammatory reaction forming a scar (Noonan and Garrett 1999).
6. MYOTENDINOUS STRAINS
Muscle strains most often occur as a result of powerful stretching when the muscle is contracted. This typically occurs during an eccentric contraction, when the muscle is being lengthened as it activates (Zarins and Ciullo 1983). In these cases, there is no external cause of trauma and the lesion basically results from an altered equilibrium between two counteracting forces: one produced by forceful, violent contraction of the muscle, the other by concurrent passive muscle overstretching itself, which is usually induced by the body weight. It has been noted that simple activation of normal muscle by nerve stimulation is unable to cause a muscle injury (Noonan and Garrett 1999). Strain lesions are typically located at the myotendinous junction when excessive tensile strength is applied (Fig. 12a). Certain muscles are injured more often than others. Muscles used for high-speed activities or rapid acceleration containing a high percentage of type 2 (fast-twitch) fibers are more predisposed to injury. In addition, muscles in which the origin and insertion cross two joints are more at risk for rupture (Noonan and Garrett 1999). The rectus femoris, the biceps femoris, and the medial head of the gastrocnemius display all these risk factors: they cross two joints and acts eccentrically at high speed.
Clinically, muscle strain injuries can be classified into a four-step grading system: grade 1 indicates a tear affecting a small number of muscle fibers with an intact fascia; grade 2 refers to a moderate tear with the fascia remaining intact; grade 3 injury is a tear of many fibers with partial tearing of the fascia; grade 4 injury indicates a complete tear of the muscle and the fascia (Ryan 1969). Healing and recovery of function takes longer with a high-grade injury, and the longterm outcome is generally worse (Noonan and Garrett 1999). Initially, treatment of a muscle strain injury includes rest, application of ice, and compression for relieve of pain and swelling; nonsteroidal inflammatory drugs may also be administered for pain relief in the first days after trauma. After resolution of the acute pain and swelling, physical therapy performed avoiding excessive fatigue and with adequate warm-up before exercise may contribute to the restoration of muscle strength and flexibility (Noonan and Garrett 1999). The long-term outcome after muscle strain injury is usually good and complications are rare.
Muscle strain injuries appear at US as avulsion and retraction of muscle fibers from the tendon or aponeurosis in which they attach (Fig. 12b,c) (Bianchi et al. 1998). The examiner must be aware that some muscles (e.g., rectus femoris) have a complex structure with internal tendons: in these cases, the injury may occur in the mid-portion of the muscle belly and not at its distal portion as may be expected (Bianchi et al. 2002). US signs of muscle tear include avulsion and proximal retraction of the fibroadipose septa. In low-grade injuries, the space between the retracted septa and the aponeurosis is filled with a hyperechoic area reflect-ing extravasation of blood and clots. These small lesions may go unnoticed if an accurate scanning technique with careful and systematic examination of the distal portion of the fibroadipose septa is not employed. On the other hand, larger muscle tears are characterized by a more substantial blood collection which makes them easily detectable. This does not occur immediately after the trauma, but 1–2 days later, when the collection tends to become more hypoechoic. A widely accepted classification of muscle injuries is based on a four-grade scale (Peetrons 2002). Grade 0 injury corresponds to a normal US appearance in spite of the presence of local clinical findings; in grade 1 injury, subtle US findings may be observed, including ill-defined hyperechoic or hypoechoic intramuscular areas or a swollen aponeurosis (Fig. 13); grade 2 and grade 3 correspond to partial and complete muscle tears, in which incomplete or full discontinuity of the muscle occurs. In mild trauma, an early assessment with US can lead to false negative results because the hematoma is diffuse and manifests as scattered blurred hyperechoic areas within muscle rather than as a focal well-defined hypoechoic collection: fat-suppressed T2-weighted MR imaging is superior to US in depicting mild strains soon after the trauma. During healing, the hemorrhagic cavity shrinks and its walls progressively thicken and collapse. The time at which the lesion is filled in can be considered an indicator for restarting low-level activity with care. However, this should be only decided in the absence of clinical symptoms and when a sufficient delay has occurred between the injury and the resumption of sports activities (never less than 4–6 weeks after the end of symptoms) (Peetrons 2002). In late phases, fibrous scars are seen as blurred hyperechoic zones within muscle: they are often observed in significant trauma or when the sporting activity was resumed too early (Fig. 14) (Peetrons 2002). Usually, scars are weakly symptomatic, but the risk of recurrent injury seems to be proportional to their extent in the muscle.
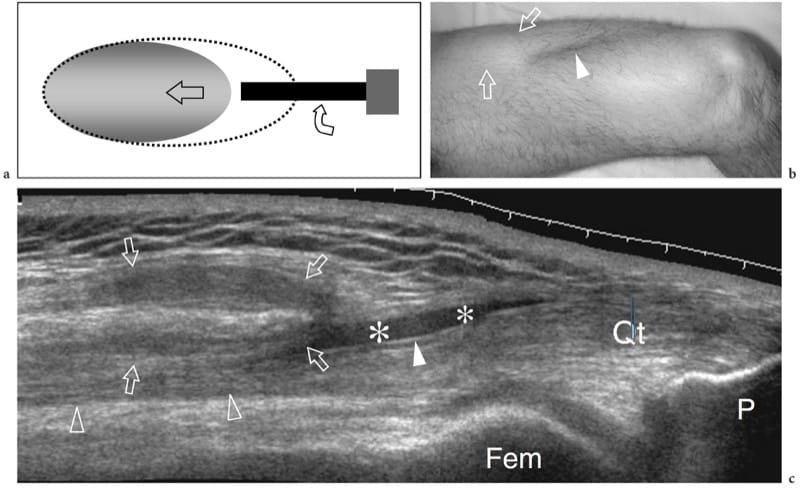
Figure 12. a–c. Complete rupture of the distal rectus femoris myotendinous junction. a Schematic drawing illustrates the trauma mechanism occurring along the muscle attachment to the aponeurosis. The injured muscle belly is retracted (arrow) and avulsed from the aponeurosis (curved arrow), whereas the tendon is intact. b Photograph reveals a deep skin defect (arrowhead) in the mid anterior thigh associated with a proximal lump (arrows) related to the retracted rectus femoris. c Extended field-of-view 12–5 MHz US image shows the retracted rectus femoris muscle (open arrows) detached from the distal deep aponeurosis (white arrowhead). A plate-like hematoma (asterisks) separates the muscle from the complex of aponeuroses of the quadriceps (open arrowhead) forming the quadriceps tendon (Qt). Fem, femur; P, patella.
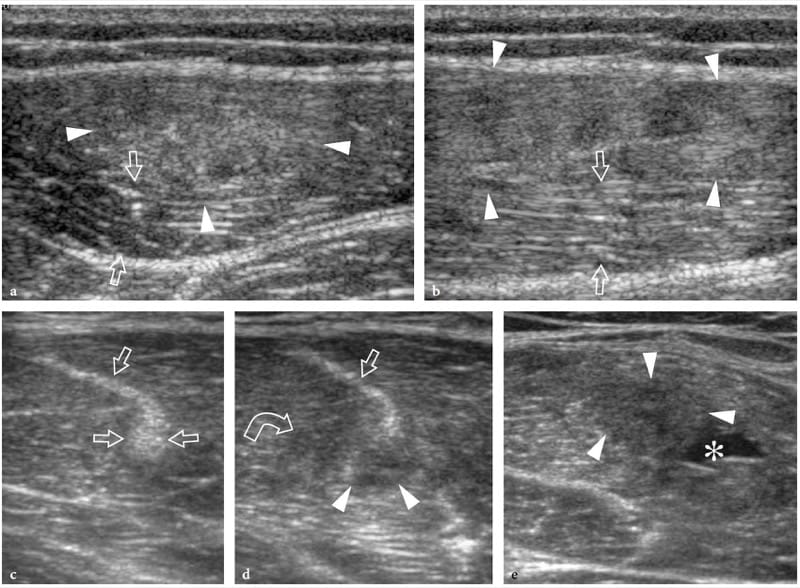
Figure 13. a–e. Myotendinous strains. Two different cases of central aponeurosis strain of the rectus femoris muscle following minimal trauma. a,b Case 1. a Short-axis and b long-axis 12–5 MHz US images over the middle third of the rectus femoris muscle demonstrate an ill-defined hyperechoic area (arrowheads) surrounding the aponeurosis related to edema and hemorrhagic changes. Note the normal-appearing external portion of the muscle (arrows). c–e Case 2. Short-axis 12–5 MHz US images obtained from c proximal to e distal over the rectus femoris reveal progressive swelling and hypoechoic appearance (arrowheads) of the central aponeurosis (straight arrows) and adjacent muscle fibers (curved arrow) with a small hematoma (asterisk) reflecting a myotendinous strain.
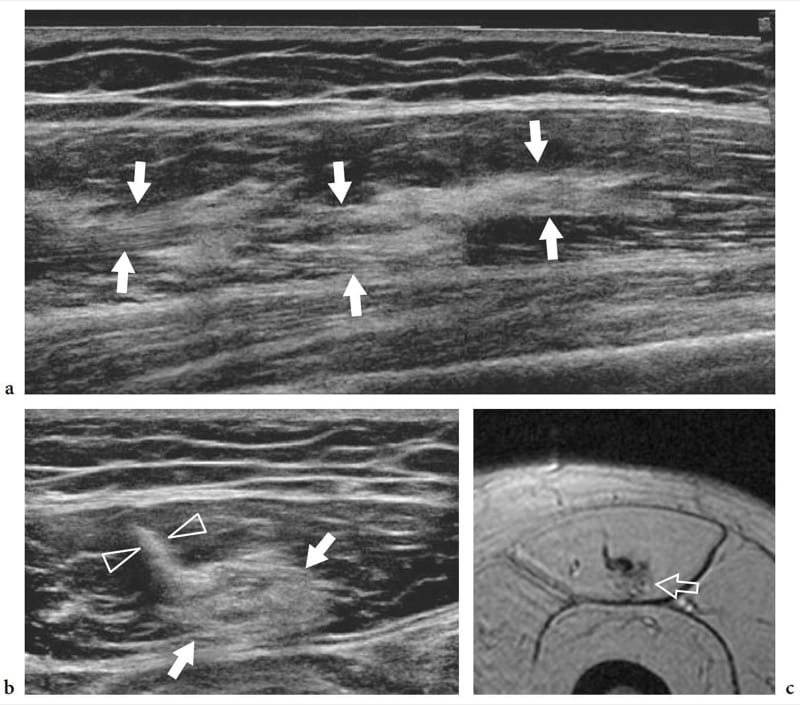
Figure 14. a–c. Healing rectus femoris strain. a Long-axis extended field-of-view and b short-axis 17–5 MHz US images of the rectus femoris muscle in a patient with prior myotendinous strain reveal an intramuscular echogenic area (arrows) in proximity to the central aponeurosis (arrowheads) representing residual scar tissue. c Correlative axial gradient-echo T2*-weighted MR image.
7. CONTUSION AND LACERATION
Direct external trauma may result in local hematoma, contusion, and partial and complete muscle laceration. Although virtually all muscles can be involved during sporting or recreational activities, the most frequently injured are the vastus intermedius and the vastus lateralis. These anterior thigh muscles are particularly predisposed to injury in athletes whose sports require direct hard contact (e.g., soccer, football, rugby, and hockey). The mechanism of injury often consists of crushing of the muscle against the femoral shaft by the knee of another player. Contusion injuries following extrinsic trauma are depicted with US as muscle swelling with focal irregularities and echotextural changes. The muscle architecture is no longer recognized as it is altered by disruption of the muscle fibers and hematoma (Fig. 15a). Depending on the overall strength of the applied force, partial or complete tears can occur. Abnormalities are typically located at the actual site of trauma and not at the myotendinous junction: this helps in distinguishing a contusion injury from a muscle strain. If a large fluid collection is present, the muscle ends can be seen floating within the hematoma. Closed muscle trauma by a sharp object may be associated with laceration of the subcutaneous tissue. In these cases, the hematoma expands vertically through the subcutaneous layer and the muscle (Fig. 15b). A direct shock injury may also result in disruption of the muscle fascia causing a muscle hernia (Bianchi et al. 1995a; Beggs 2003). In these patients, US demonstrates interruption of the hyperechoic fascial layer and focal extrusion of muscle tissue within the subcutaneous fat. Muscle lacerations are much less common and are more often encountered after trauma than after sports accidents. In these instances, irrigation and debridement followed by suture repair of the fascia is indicated.
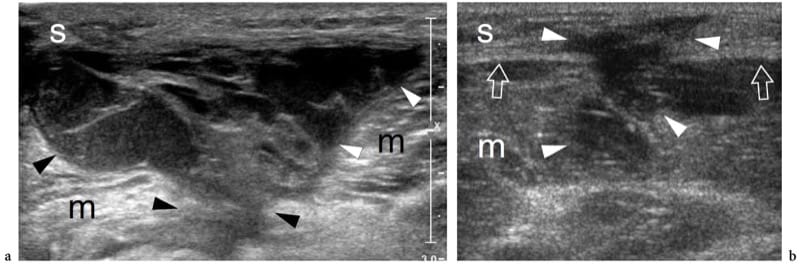
Figure 15. a,b. Closed contusion trauma. Two different cases of thigh muscle injuries following blunt trauma by sharp objects. a Transverse 12–5 MHz US image over the vastus lateralis (m) reveals an extensive laceration of muscle tissue filled in with hypoechoic hematoma (arrowheads). Note the intact subcutaneous tissue (s). b Transverse 12-5 MHz US image over the medial thigh demonstrates combined laceration of the subcutaneous tissue (s) and the gracilis muscle (m) with interruption of the fascia (arrows). The defect is filled in with hypoechoic hematoma (arrowheads).
8. MYOSITIS OSSIFICANS
There are three main complications of muscle tear: cysts and myositis ossificans and, more rarely, calcific myonecrosis (Peetrons 2002). Intermuscular and intramuscular cysts may be encountered after muscle trauma as well-defined echo-free masses with posterior acoustic enhancement. These cysts have an elongated shape and represent the residue of a local hematoma. Their most common location is the calf. In selected cases, they may require percutaneous needle evacuation. Calcific myonecrosis is a space-occupying calcified mass that typically develops in the anterior compartment of the leg late after a closed lower extremity trauma, and is often seen in association with vascular injury or a compartment syndrome (Dhillon et al. 2004). In this condition, the injured muscle may be replaced with a complex mass consisting of a central cystic core containing necrotic muscle, fibrin, cholesterol, and organizing thrombus, together with a peripheral calcified rim. US demonstrates calcified myonecrosis as an intramuscular extensive calcified mass with posterior acoustic shadowing and may help to guide the aspiration of the fluid component as an aid in management (Batz et al. 2006). The main differential diagnosis of calcific myonecrosis is the more common myositis ossificans, given the fact that the extensive calcified shell may mask the internal fluid component at US examination.
Myositis ossificans is a benign self-limiting condition presenting as an intramuscular mass with pre-dominant involvement of the large muscles of the extremities, the large muscles of the thigh and the anterior muscles of the arm being the most commonly affected (Thomas et al. 1991). The term “myositis” is a misnomer because this condition is not inflammatory. It usually results from a severe contusion trauma or chronic microtrauma, but may also be seen in patients with other disease or may develop spontaneously. There is, however, debate as to whether unrecollected trauma is present in these cases. From the histologic point of view, this condition exhibits a typical maturation pattern that allows a proliferative mesenchymal response (early pseudosarcomatous phase) to evolve toward formation of heterotopic mature bone. During maturation of the lesion, a zonal pattern develops with three concentric zones: the inner zone is characterized by areas of hemorrhage and necrotic muscle with proliferating fibroblasts; the middle zone consists of immature osteoid formation and islets of cartilage preceding bone formation; and the outer zone is formed by mature bone (Gindele et al. 2000). Peripheral bone formation usually starts 6–8 weeks after the trauma, but it can occur earlier. In the late phase, the lesion can ossify as a whole with formation of a cortex and marrow spaces (Ackermann 1958). As it matures the lesion regresses in size, disappearing spontaneously in approximately 30% of cases (Schulte et al. 1995). Development of peripheral calcifications is a peculiar feature of myositis ossificans and makes this condition more easily diagnosed with X-ray modalities, including plain films and CT, than with US and MR imaging. In the early stages of disease (before the sixth week of evolution), when formation of calcifications has not yet occurred, the imaging diagnosis is not straightforward: it can be difficult to distinguish lesions at this stage from a soft-tissue malignancy.
The US findings of myositis ossificans change with the lesion’s age, reflecting the evolving histology (Fornage and Eftekhari, 1989; Peck and Metreweli, 1988). Initially, the US appearance of myositis ossificans has been described as that of an intramuscular hypoechoic ovoid mass with an echogenic center, and even a so-called zone phenomenon matching the maturation process has been reported (Kramer et al. 1979; Thomas et al. 1991; Gindele et al. 2000). In more detail, early lesions are characterized by a peripheral thin hypoechoic zone enveloping a broader highly reflective zone within which a third central hypoechoic zone is found (Fig. 16a) (Thomas et al. 1991). With progressive maturation, the peripheral hypoechoic rim may become hyperechoic as a result of increasing ossification: a sheet-like or egg-shell-like calcified rim is considered very suggestive of myositis ossificans (Peck and Metreweli, 1988). Then, visualization of the lesion center and the separation of the lesion from the underlying bony cortex may become more difficult because of the acoustic shadowing from peripheral calcifications (Gindele et al. 2000). The process of ossification is apparent with US approximately 2 weeks earlier than with plain radiographs (Peetrons 2002). Although the typical pattern of calcifications is characteristic, we believe that a standard radiograph must always be obtained to confirm the diagnosis and to exclude more aggressive calcified lesions, including paraosteal and soft-tissue sarcomas (Fig. 16b,c). After surgical resection, US has proved able to detect recurrence of myositis ossificans and to differentiate this condition from extraosseous sarcomas (Okayama et al. 2003).
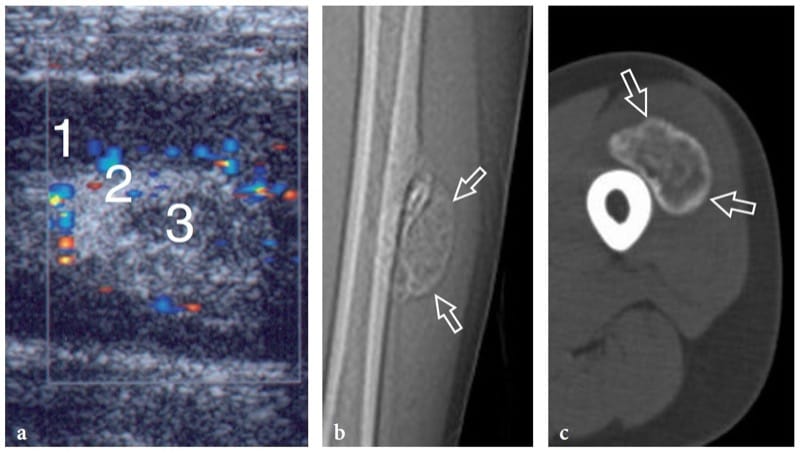
Figure 16. a–c. Myositis ossificans. a Transverse 10–5 MHz US image over the quadriceps femoris in an 8-year-old child with prior contusion trauma and a painful palpable mass over the anterior thigh reveals a “target pattern” in the vastus intermedius reflecting early changes of myositis ossificans. Three concentric areas can be distinguished: an outer hypoechoic (1), an intermediate hyperechoic (2), and a central hypoechoic (3) zone. b Radiographic and c CT correlation obtained 2 months later demonstrate the typical “eggshell-like” calcified rim (arrows) of myositis ossificans. The CT scan was performed to ensure the extrinsic nature of the calcification relative to the femoral shaft. (Courtesy of Dr. Paolo Tomà, Italy).
9. INFLAMMATORY AND ISCHEMIC CONDITIONS
Inflammatory myopathies include a heterogeneous group of acquired and potentially treatable disorders caused by an autoimmune process (idiopathic inflammatory myosites) or infectious agents (pyomyositis). Among ischemic conditions, we focus here mainly on diabetic muscle infarction and rhabdomyolysis.
10. IDIOPATHIC INFLAMMATORY MYOPATHIES
Based on their unique clinical, histopathologic, immunologic, and demographic features, idiopathic inflammatory myopathies can be classified into three major and distinct types: polymyositis, dermatomyositis, and sporadic inclusion-body myositis (Dalakas and Hohlfeld 2003). Polymyositis predominantly affects women and is characterized by the presence of moderate to severe muscle weakness and autoimmune inflammation with lymphohistiocytic infiltrates within muscles, the precise cause of which is still unknown (Garcia 2000). The diagnosis is essentially based on proximal and symmetric muscle weakness with or without pain, increased serum creatine kinase activity, abnormal findings at electromyography, necrosis of muscle fibers, and regeneration and mononuclear cell infiltrates with or without perifascicular atrophy at biopsy (Fig. 17). In dermatomyositis, exanthemas (typically involving the face, the chest and the extensor surfaces of the extremities) are associated with the above features. Nevertheless, serum creatine kinase level, in isolation, is a poor indicator of the disease and needle electromyographic signs are not disease-specific (Garcia 2000; Mastaglia et al. 2003). In patients with polymyositis and granulomatous myositis, gray-scale US seems to show increased echogenicity reflecting muscle edema in the acute phases of the disease process, but this sign is nonspecific (Reimers et al. 1993; Reimers and Finkenstaedt 1997). Although fat-suppressed T2-weighted MR imaging is currently the imaging modality of choice in this situation due to its ability to depict muscle edema power Doppler US has been proposed as a means to assess muscle vasculature changes in patients with myositis (Newman and Adler 1998; Meng et al. 2001). A hypervascular pattern within muscles was found to correlate with diseases of shorter duration and with creatine kinase activity (Meng et al. 2001). The color Doppler imaging findings varied with the clinical course of disease more than did those of gray-scale US (Meng et al. 2001). In an attempt to quantify muscular capillary per-fusion, a recent study based on contrast-enhanced US showed significantly higher blood flow velocity, blood flow, and blood volume in patients with acute myositis than in normal volunteers (Weber et al. 2005). Depiction of an increased muscle perfusion in polymyositis and dermatomyositis may help to identify a suitable biopsy site in patients with typical disease presentation and previous negative or nonspecific biopsy results (Weber et al. 2005).
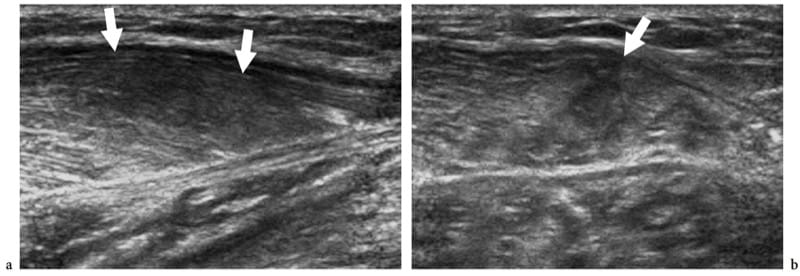
Figure 17. a,b. Polymyositis and associated scleroderma. a Long-axis and b short-axis 12–5 MHz US images over the medial head of gastrocnemius reveal an intramuscular ill-defined hypoechoic area (arrows) with loss of the fibroadipose pattern, reflecting edema and fatty tissue infiltration. The subcutaneous tissue appears normal.
Proliferative myositis is a rare self-limiting intramuscular inflammatory process presenting at a median age of 50 years that may clinically mimic malignancy (Pagonidis et al. 2005). It is characterized by a rapidly growing mass (even doubling in size within a few days) that diffusely infiltrates the muscle tissue with spindle-shaped and giant ganglion cell-like elements. Typically, proliferative myositis heals spontaneously and no treatment is indicated. US may reveal proliferative myositis as a heterogeneous mass with calcifications (Mulier et al. 1999; Wlachovska et al. 2004). This lesion has been described as having a “scaffolding” pattern between continuous muscle bundles on long-axis scans and a “checkerboard” pattern on short-axis images (Sarteschi et al. 1997). Longitudinal US images may also demonstrate muscle swelling with preservation of the normal fibrillar pattern, disrupted by hypoechoic lines in a geometric shape, somewhat resembling “dry cracked mud” (Fig. 18) (Pagonidis et al. 2005). Although imaging studies may suggest such an inflammatory process (very rapidly growing mass in a muscle compartment), incisional biopsy is usually needed to rule out soft-tissue malignancy and to avoid radical excision.
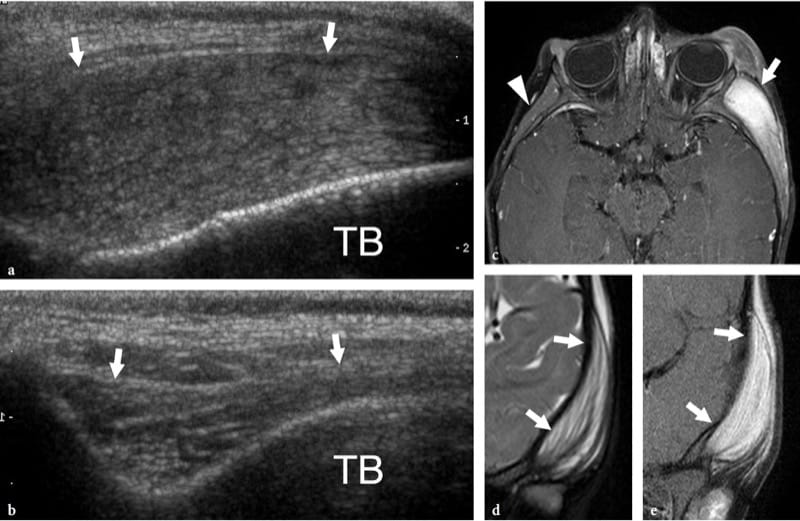
Figure 18. a–e. Proliferative myositis. a Longitudinal 12–5 MHz US image along the temporal muscle in a child with intense softtissue swelling of the left cheek and zygomatic area. The muscle (arrows) appears swollen with hyperechoic bundles separated by randomly distributed hypoechoic lines, a pattern resembling dry, cracked mud. TB, temporal bone. b Normal contralateral side. c Axial and d coronal fat-suppressed T1-weighted and e coronal fat-suppressed T2-weighted MR images demonstrate a swollen hyperintense left temporal muscle (arrows) containing isointense to muscle stripes. Note the normal contralateral temporal muscle (arrowhead) for comparison.
Sarcoidosis, a systemic granulomatous disease, may occasionally involve the skeletal muscles, leading to either palpable nodules or chronic progressive wasting and muscle atrophy or acute myositis (Otake 1994; Tohme-Noun et al. 2003). The muscles of the proximal portions of the extremities are predominantly involved. In nodular-type sarcoidosis, US is able to display well-defined hypoechoic nodules elongated along the muscle fibers and to guide percutaneous biopsy to the appropriate site (Levine et al. 1996; Tohme-Noun et al. 2003). Histologic detection of noncaseating granulomas surrounded by normal muscle tissue allows a definitive diagnosis. In large sarcoid nodules, a hyperechoic center can be depicted with US (Otake 1994). In patients with pulmonary sarcoidosis and painful leg muscles, the possibility of muscular sarcoidosis should be taken into account by the examiner. Color Doppler imaging may be helpful to rule out phlebitis.
11. PYOMYOSITIS, ABSCESS, AND HYDATID DISEASE
Pyomyositis is a suppurative bacterial infection of muscle, most commonly affecting the larger muscles of the lower limb (Chau and Griffith 2005). This condition most often occurs in immunocompromised patients with HIV-AIDS or diabetes and has a higher prevalence in tropical countries, where it is responsible for 3–5% of all hospital admissions (Canoso and Barza 1993; Trusen et al. 2003). However, it may follow even minor blunt trauma and local hematoma. The major causative agent is Staphylococcus aureus followed by Mycobacterium tuberculosis (psoas muscle infection following tuberculous spondylodiscitis), and Streptococcus pyogenes (Bickels et al. 2002). From the clinical point of view, pyomyositis presents with or without fever, dull cramping pain for 10–21 days, and localized muscle tenderness (Trusen et al. 2003). The US appearance of infection of the muscles has been described both in adults (Chau and Griffith 2005) and in children (Trusen et al. 2003). Initially (inflammatory phase), US reveals muscle swelling, a diffuse hyperechoic appearance reflecting edema, and hyperemia (Fig. 19) (Bureau et al. 1999; Chau and Griffith 2005). Small hypoechoic foci within the abnormal muscle related to early necrosis and small abscesses may be noted. At this stage, pyomyositis usually responds well to antibiotic therapy. Later in the course of the disease, an overt muscle abscess develops (suppurative phase).
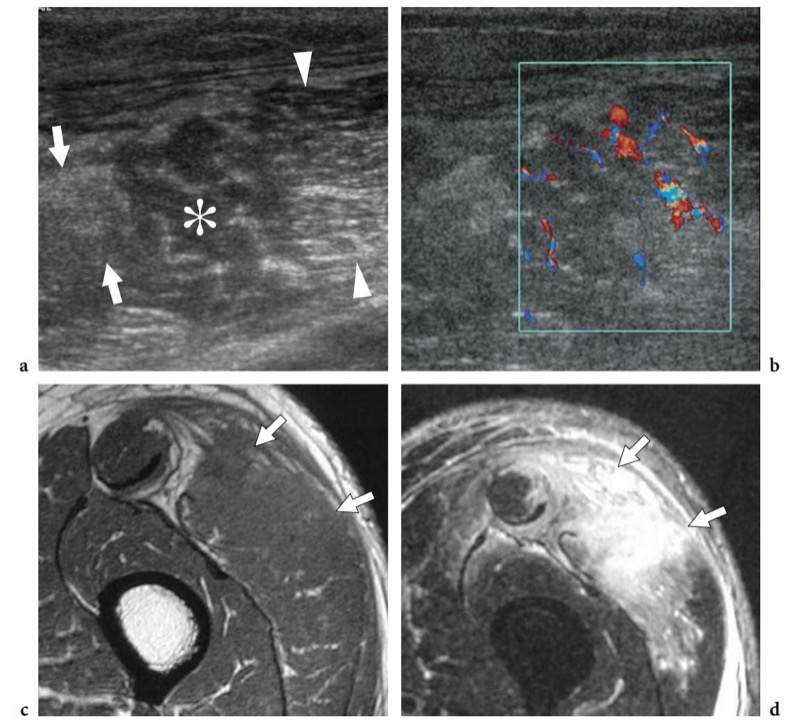
Fig. 19a-d. Pyomyositis in a 65-year-old man with fever and left thigh pain after sustaining blunt trauma to this area. a,b Transverse a gray-scale and b color Doppler 12–5 MHz US images reveal a swollen vastus lateralis muscle with heterogeneous echotexture consisting of increased echogenicity (arrows) as well as hypoechoic areas (asterisk) in which fibroadipose echoes are lost or spaced out. Posterior to this abnormal area, muscle tissue retains a normal appearance (arrowheads). Diffuse intramuscular hyperemia is detected at color Doppler imaging. c,d Correlative axial c T1-weighted and d T2-weighted MR images demonstrate marked hyperintense T2 signal and swelling of the vastus lateralis with irregular borders and diffuse fascial involvement (arrows).
Muscle abscesses appear as fluid collections with well-defined posterior enhancement and variable echotexture, ranging from hypoechoic to hyperechoic (Fig. 20) (Bureau et al. 1999). Gas bubbles can occasionally be found within reflecting gas-forming organisms. Color Doppler imaging shows hyperemia of the internal septa and, even more frequently, increased peripheral vascular signals located within the abscess wall or in the surrounding tissue (Gottlieb et al. 1995; Arslan et al. 1998). The late stage yields more profound systemic manifestations that require urgent treatment with aggressive antibiotic therapy. US-guided aspiration and drainage of muscle abscess using large-bore needles is required for complete resolution (Rubens et al. 1997; Bureau et al. 1999).
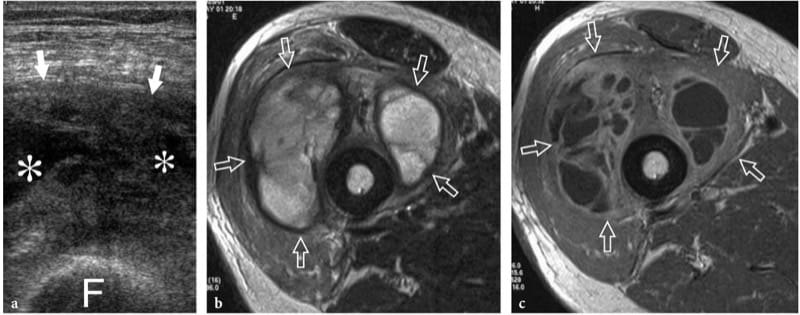
Figure 20. a–c. Muscle abscess. a Transverse 12–5 MHz US image over the anterior thigh in a middle-aged immunocompromised patient with fever, pain, and local signs of infection with b T2-weighted and c Gd-enhanced T1-weighted MR imaging correlation shows a swollen heterogeneous vastus intermedius muscle (arrows) with internal fluid-filled areas (asterisks) and debris, consistent with local abscess formation. F, femoral shaft. US-guided aspiration yielded purulent fluid that grew Staphylococcus aureus up. Symptoms resolved with percutaneous drainage and antibiotic therapy.
Parasitic and fungal infections of muscle are extremely rare. Among them, hydatid disease is a disease caused by a tape-worm, Echinococcus granulosus, which is usually ingested through contact with dogs or by contaminated food and drink. In the western world, the disease is more often encountered in Mediterranean countries with sheep rearing. Although the preferred site of infection is the liver (65–75%) and the lung (25–30%), hydatid disease may occasionally involve the musculoskeletal system (1–5%), including skeletal muscles and subcutaneous fat, usually in association with other liver or lung lesions (Mani et al. 2001; Melis et al. 2002). The psoas and quadriceps seem to be the most commonly involved muscles. The imaging appearance of hydatid cysts is multifaceted (García-Díez et al. 2000). US may suggest the diagnosis only in the case of an intramuscular and intermuscular cyst containing internal rounded cysts, the so-called “cysts within a cyst”, which represent daughter vesicles (Fig. 21).
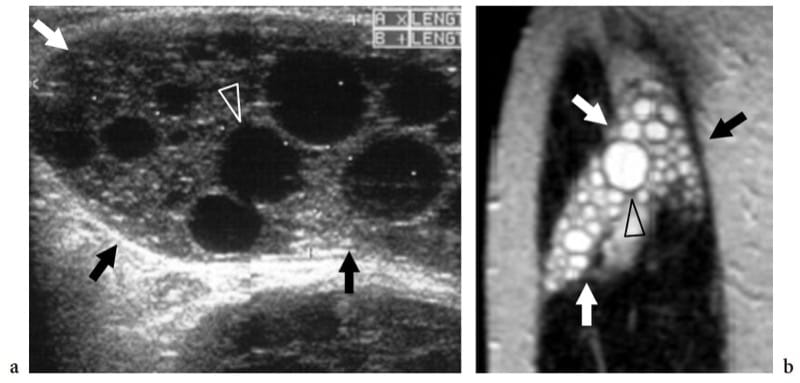
Figure 21. a,b. Echinococcosis (hydatid cyst). a Longitudinal 10–5 MHz US image over the lateral thigh with b T2-weighted MR imaging correlation demonstrates an intramuscular complex multilocular mass (arrows) involving the vastus lateralis. The mass contains multiple rounded cysts (arrowhead), reflecting daughter vesicles within the mother cyst. (Courtesy of Dr. Vincenzo Migaleddu, Italy).
12. DIABETIC MUSCLE INFARCTION AND RHABDOMYOLYSIS
Diabetic muscle infarction is a rare complication of patients with longstanding poorly controlled diabetes mellitus, who usually present with severe indexes of target organ damage, including nephropathy, retinopathy, neuropathy, and hypertension (Chason et al. 1996). This condition seems to be more likely due to extensive thrombosis of medium and small arterioles of muscles rather than embolized atherosclerotic plaque (Jelinek et al. 1999): thigh (the quadriceps) or calf muscles are the most commonly affected (Chason et al. 1996). Clinically, patients with diabetic muscle infarction present with sudden onset of severe local pain, a normal creatine kinase level, and development of a palpable mass in an extremity (Vande Berg et al. 1996; Delaney-Sathy et al. 2000). From the histopathologic point of view, the affected muscles show infarcted areas with zonal necrosis, foci of hemorrhage with fibers in various stages of degeneration and regeneration, fatty muscle infiltration, and interstitial fibrosis (Jelinek et al. 1999). During the acute phase, US demonstrates diabetic muscle infarction as an intramuscular hypoechoic lesion with mixed echogenicity and internal linear echoes reflecting muscle fibers (Fig. 22) (Delaney-Sathy et al. 2000). As the lesion is not compressible, US may help to distinguish it from an abscess. However, the ultimate role of US imaging in this field has yet to be defined.
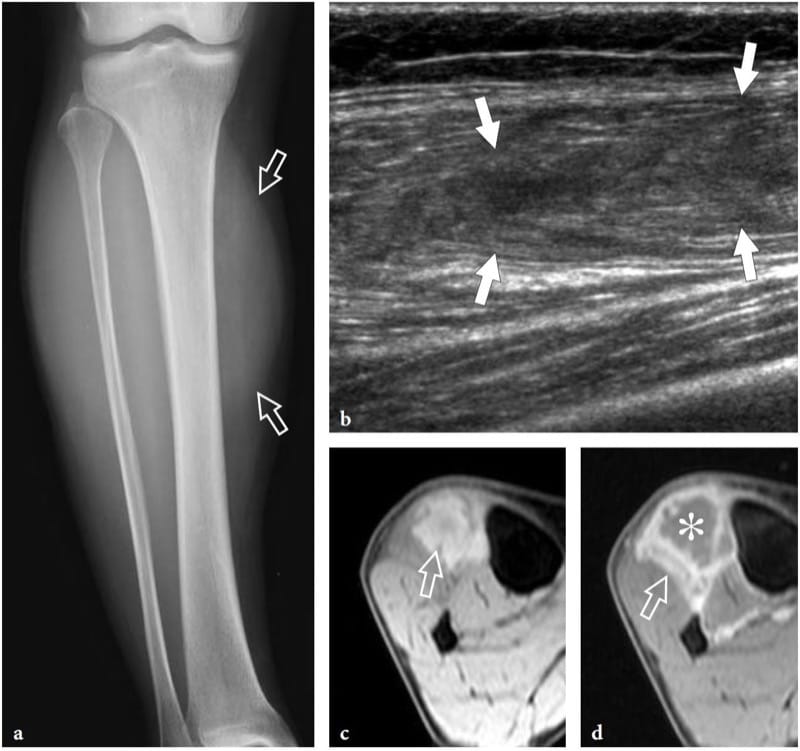
Figure 22. a–d. Diabetic infarction. a Anteroposterior plain film of the right leg in a 60-year-old patient with diabetic infarction of the distal lower extremity shows discrete soft-tissue swelling (arrows) in the anterolateral compartment musculature. b Longitudinal 12–5 MHz US image reveals a hypoechoic intramuscular area with deranged echotexture (arrows), which is limited to the tibialis anterior muscle. c,d Axial fat-suppressed c gradient-echo T2* and d gadolinium-enhanced T1-weighted MR images show diffuse edema of the tibialis anterior muscle (arrow) and a ring of high signal intensity after gadolinium administration surrounding an unenhanced central core (asterisk).
Rhabdomyolysis indicates a process of severe muscle injury characterized by lysis of skeletal muscle cells that may result from a variety of injuries, such as crush trauma, ischemia, toxins, autoimmune inflammatory conditions, and heparin therapy (May et al. 2000). The diagnosis is often missed because clinical symptoms may be indefinite or absent. US demonstrates areas of decreased and increased echogenicity and local disorganization of fascicular architecture of the affected muscles (Lamminen et al. 1989; Steeds et al. 1999). In acute phases, US may help to detect the affected muscle group for immediate surgical decompression. Further details of the US appearance of rhabdomyolysis are illustrated in the compartment syndromes.
13. TUMORS
Tumors of the skeletal muscle are rare compared with traumatic lesions. Most of them are benign. However, the occurrence of a malignant neoplasm should be always kept in mind when evaluating a mass, even in a post-traumatic setting, because local trauma does not necessarily exclude the presence of a pre-existing tumor. In this section we focus on the US appearance of the most common tumors of muscle, considering the histotypes in which this technique is able to provide the most valuable information. Some histotypes, such as lipomas and hemangiomas, which typically involve muscles but are not of muscular origin, are also discussed here.
14. INTRAMUSCULAR HEMANGIOMA
Deep-seated hemangiomas are common benign soft-tissue tumors which often arise within muscles. They predominantly involve the large muscles of the thigh and may be painful if the affected muscle is narrow and long, probably through stretching of the muscle fibers. The term “hemangioma” encompasses a wide spectrum of lesions from capillary forms to vascular malformations – including capillary, cavernous, arteriovenous, venous, and mixed types – based on the predominant type of vascular channel involved (Olsen et al. 2004). In addition to their vascular components, hemangiomas can contain thrombus, calcification, hemosiderin, fat, smooth muscle, and fibrous tissue, reactive fat being the most common association. The variety of tissues found in muscular hemangiomas explains their heterogeneous appearance. US demonstrates a complex ill-defined mass within the affected muscle, characterized by a mixture of hypoanechoic and hyperechoic (reactive fat overgrowth) components (Fig. 23) (Derchi et al. 1989). Prominent vascular channels can be identified on gray-scale and Doppler imaging as well. One-to-one correlation between US and MR images shows good correspondence between intratumor hyperechoic areas and fat (high T1 signal), and hypoechoic components and blood-filled cavities (high T2 signal). Phleboliths within the mass are present in approximately 50% of cases and are best identified on plain films (Fig. 23f) (Murphey et al. 1995). At US, they appear as bright dots with posterior acoustic shadowing that are usually located within the hypoechoic component of the hemangioma. Overall, US can diagnose hemangiomas, especially when phleboliths are detected within the mass. During prolonged observation, very slow blood motion in the hypoechoic cavities of the mass can be appreciated on gray-scale imaging, like a “swarming mass”. In some instances, however, the assessment of hemangiomas may be difficult: in particular, the boundaries of the lesion are usually undefined, especially in large masses infiltrating more than one muscle or blending imperceptibly with the intermuscular fatty planes.
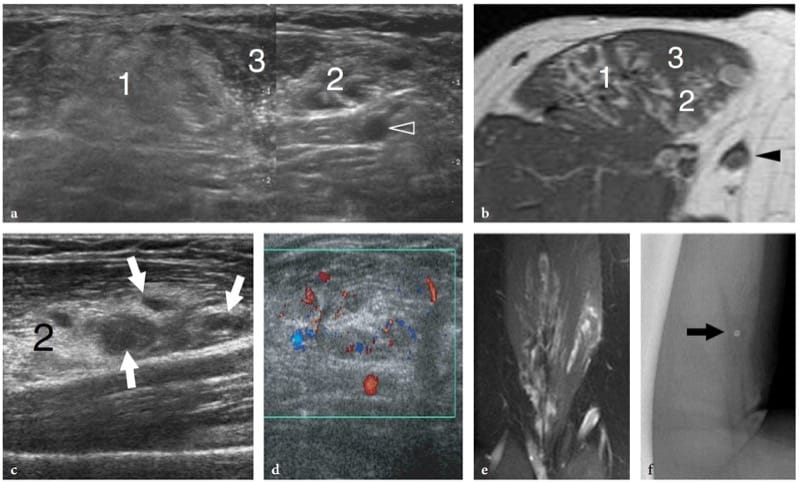
Figure 23. a–f. Intramuscular hemangioma. a Transverse 12–5 MHz US image over the anterior arm with b T1-weighted MR imaging correlation demonstrates an ill-defined intramuscular mass composed of a mixture of components, including homogeneous hyperechoic tissue (1) related to reactive fat overgrowth, residual muscle tissue (3), and hyperechoic tissue with prominent vascular channels (2). Arrowhead, basilic vein. A split-screen image was used, with the two screens aligned for an extended field of view. c,d A closer look at the vascular component of the hemangioma (2) shows prominent hypoanechoic channels (arrows) characterized by slow blood flow at color Doppler imaging assessment. e Coronal T2-weighted MR image demonstrates the craniocaudal extension of the hemangioma within the biceps brachii muscle. f Lateral radiograph of the arm shows a phlebolith (arrow).
15. DEEP-SEATED LIPOMA AND LIPOSARCOMA
Deep-seated lipomas may arise within (intramuscular lipoma) or among muscles (intermuscular lipoma) and are less common than subcutaneous lipomas (Fletcher and Martin-Bates 1988). The intramuscular origin is more common than the intermuscular variant. Lipomas can affect both the muscle and intermuscular connective tissue (Kransdorf et al. 1993; Murphey et al. 2004). The preferred sites of intramuscular lipomas are the large muscle of the extremities (e.g., thigh, trunk, shoulder, and arm). Clinically, they present as slowly growing painless masses but, in some cases, they grow rapidly causing symptoms of nerve entrapment (Muren et al. 1994). Benign intramuscular lipomas can be arbitrarily subdivided into a well-circumscribed type and an infiltrative type. In the former, fatty tissue is clearly delineated from the surrounding muscle. US demonstrates a well-defined ovoid mass contained inside a muscle with the typical striated appearance of superficial lipomas: a degree of heterogeneity can be related to thin intrinsic septa. In its intramuscular location, the mass is not compressible and no Doppler signal is noted within. Intramuscular lipomas may also become more apparent as distinct masses with muscle contraction. Some lesions appear nearly isoechoic with the adjacent muscle tissue. In these cases, careful scanning technique is needed not to miss even large masses by confusing them with surrounding muscle bellies. In the infiltrative type, there is replacement of muscle tissue in a bland fashion by fat, and muscle fibers are separated by proliferation of fat among them (Matsumoto et al. 1999). At US examination, this produces a heterogeneous striated mass with undefined characteristics that may not resemble a lipoma (Fig. 24). One should remember that the infiltrative pattern does not represent a sign of malignancy in intramuscular lipomas. Although the hyperechoic appearance of these masses suggests fat, in our experience MR imaging is much superior to US for the confident identification of adipose tissue in infiltrative lipomas.
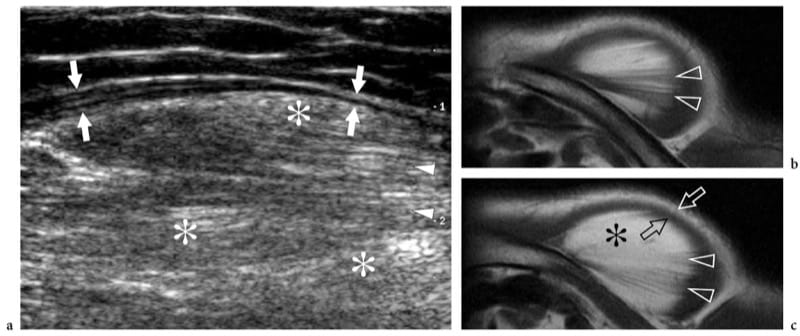
Figure 24. a–c. Intramuscular lipoma: infiltrative type. a Transverse 12–5 MHz US image over the anterior shoulder in a patient with a painless slowly growing mass with b,c axial T1-weighted MR imaging correlation demonstrates a large mass within the deltoid muscle characterized by a hyperechoic background (asterisks) and a striated pattern (arrowheads) due to intermingled muscle fibers with fat. The lipoma is delimited by a thin hypoechoic rim (arrows) reflecting peripherally displaced muscle tissue.
After fibrous and fibrohistocytic malignancies, liposarcoma represents the second most common type of soft-tissue sarcoma, accounting for approximately 10–25% of all soft-tissue sarcomas (Murphey et al. 2005). It is predominant in men around the fifth and sixth decades of life and does not represent the result of malignant transformation of a lipoma. Histopathologically, liposarcomas are grouped in five subtypes: well-differentiated, myxoid, round cell, pleomorphic, and dedifferentiated. Well-differentiated liposarcoma is the most common type (50%); it lacks metastatic potential but tends to recur locally. US shows large, multilobulated, well-defined masses which, in most cases, are indistinguishable from mature lipomas (Fig. 25) (Futani et al. 2003; Murphey et al. 2005). Based on gray-scale US findings, lipoma-like lesions with a complex appearance (containing thick septa and nodular or globular foci with echotexture other than that of fat) always merit further investigation with contrast-enhanced MR imaging (Fig. 26). Finding blood flow signals in a lipoma-like mass with color and power Doppler imaging should also alert the examiner (Bodner et al. 2002; Futani et al. 2003). Unlike well-differentiated liposarcoma, myxoid liposarcoma presents as a well-circumscribed multinodular mass whose gross pathologic appearance includes a smaller volume of fat (often <10% of the total) and a variable mixture of myxoid and round cell components. US demonstrates a complex hypoechoic mass with posterior acoustic enhancement, a nonspecific appearance quite different from that of typical lipomas (Sung et al. 2000). Based on the nonenhanced MR imaging findings (high T2 signal related to the myxoid component), myxoid liposarcoma may often resemble a cyst. This pitfall seems particularly likely in the popliteal fossa, where the cyst-like mass may mimic a Baker cyst. In these cases, US may be helpful in revealing that the mass does not meet the criteria for a cyst (Sung et al. 2000). Finally, the round cell, pleomorphic and dedifferentiated forms are locally aggressive tumors with high metastatic potential. They show nonlipomatous components which may be predominant with little or no fat (round cell and pleomorphic). Accordingly, the US and MR imaging diagnosis of these latter masses may be very difficult due to their nonspecific appearance.
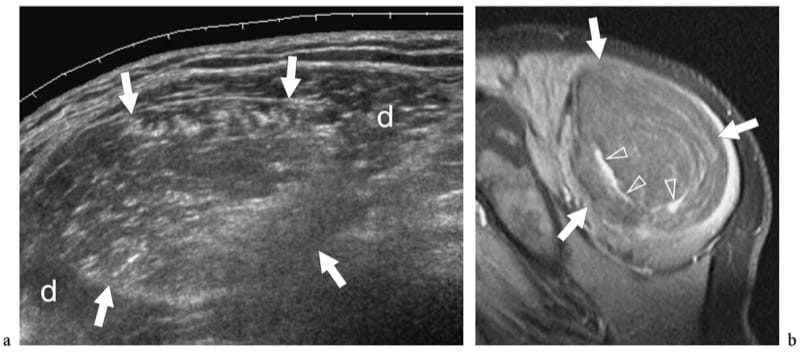
Figure 25. a,b. Intramuscular well-differentiated liposarcoma. a Sagittal 12–5 MHz US image over the posterolateral shoulder demonstrates a large intramuscular rounded mass (arrows) expanding within the deltoid muscle (d). The mass is sharply demarcated and has heterogeneous hyperechoic echotexture relative to the adjacent musculature suggesting fat. b Correlative sagittal fat-suppressed T1-weighted MR image after administration of contrast material shows a large mass composed of fat with prominent enhancing septa (arrowheads). A well-differentiated liposarcoma was diagnosed at histopathologic examination. Note that the enhancing septa visible at MR imaging were not seen at US examination. Overall, the ability to diagnose well-differentiated liposarcoma with US, compared with MR imaging, is limited.
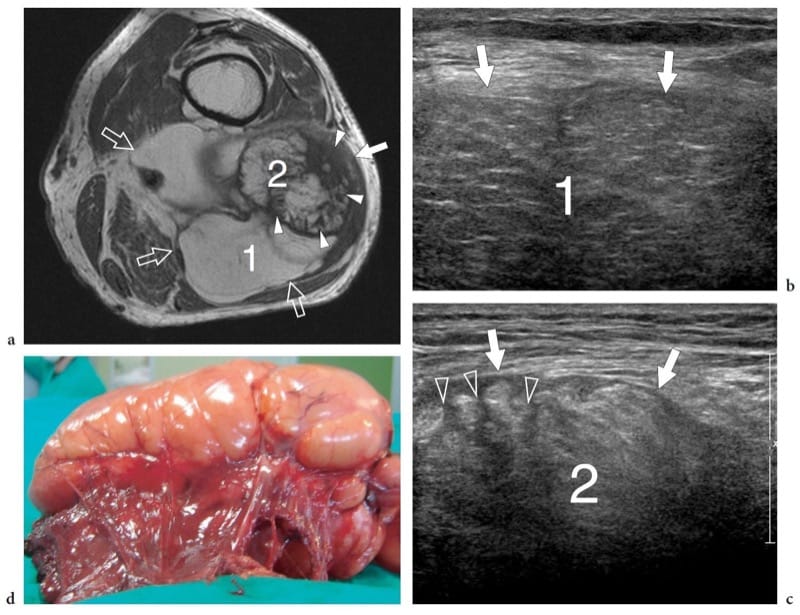
Figure 26. a–d. Intramuscular dedifferentiated liposarcoma. a Transverse T1-weighted MR image of the upper popliteal region in a 70-year-old man with a painless, slowly growing (over 5 years) space-occupying lesion that had been clinically diagnosed as a popliteal cyst demonstrates a large heterogeneous intramuscular lipomatous mass (arrows) arising from the biceps femoris with intermuscular extension. The mass is characterized by a large lipomatous part (1) and an additional area (2) with thick septa and nodular nonlipomatous areas (arrowheads). b,c Transverse 12–5 MHz US examination of the two areas that are indicated in a as 1 and 2 reveals a heterogeneous mass (arrows) with both striated hypoechoic areas (1), corresponding to lipomatous tissue, and regions of higher echogenicity (2) traversed by thick hypoechoic septations (arrowheads). d Gross surgical specimen.
16. INTRAMUSCULAR MYXOMA
Intramuscular myxoma is a slowly growing benign tumor composed of abundant myxoid deposits and fibroblasts (Murphey et al. 2002; Luna et al. 2005). Intramuscular myxomas primarily affect patients 40–70 years old with a female predominance, and are more commonly located in the large muscles of the thigh, shoulder, buttocks, or upper arm. US demonstrates intramuscular myxoma as a well-demarcated solid or mixed hypoechoic lesion with fluid-filled clefts or internal cystic foci reflecting myxoid stroma (Fornage and Romsdahl 1994; Murphey et al. 2002). Through sound transmission is usually observed. There are specific imaging findings which are strongly suggestive of intramuscular myxoma and may help the differential diagnosis. The first is the presence of a small amount of hyperechoic fat surrounding the nodule, most commonly observed at the upper and lower poles of the lesion, the so-called fat cap or fat rind (Fig. 27) (Bancroft et al. 2002; Murphey et al. 2002; Luna et al. 2005). This sign may also be found in neurogenic tumors, but in these later histotypes the diagnosis is based on detection of continuity of the opposite poles of the mass with the parent nerve. The second is detection of edema surrounding the lesion: for which T2-weighted MR imaging seems to be superior to US (Bancroft et al. 2002). Although the recognition of these features does not obviate biopsy, it allows more accurate preoperative planning. One should take into account that the MR imaging features of intramuscular myxoma may be misleading, resembling those of a cyst with homogeneously low signal intensity on T1-weighted images and high signal intensity on T2-weighted or fluid-sensitive MR sequences (high water content). US can contribute to distinguishing the two histotypes. In addition, MR imaging features of intramuscular myxoma may be shared with other myxoid lesions, including myxoid liposarcoma in an intramuscular location (Sung et al. 2000). Differentiating between these two lesions has major implications because myxoma has a benign clinical course with no tendency to recur or metastasize.
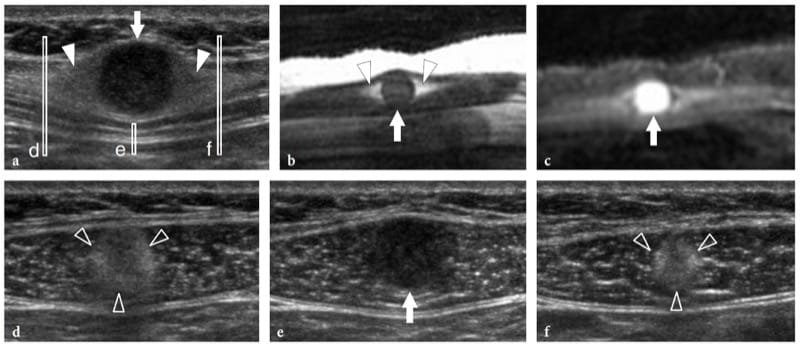
Figure 27. a–f. Intramuscular myxoma. a Sagittal 12–5 MHz US image over the anterior abdominal wall in a patient with a small painless palpable mass of unvaried size with correlative sagittal b T1-weighted and c fat-suppressed T2-weighted MR images demonstrates a well-circumscribed rounded homogeneously hypoechoic mass (arrow) within the right rectus abdominis muscle with a rind of fat at its superior and inferior aspects (arrowheads). The mass appears isointense to muscle on the T1-weighted image and has high signal intensity, similar to that of fluid, on the T2-weighted image. d–f Transverse 12–5 MHz US images obtained at the levels indicated in a (vertical white bars) show d the cranial fat cap (arrowheads), e the nodule (arrow), and f the lower fat cap (arrowheads). Note that the lesion is fully intramuscular in its location.
17. DESMOID
Extra-abdominal desmoids, also known as aggressive fibromatosis, are rare soft-tissue tumors arising from the connective tissue of muscle, overlying fascia or aponeurosis (Robbin et al. 2001). The prognosis of desmoids is somewhat related with the patient’s age (peak incidence between 25 and 40 years), the more aggressive lesions being found in patients under the age of 30 years. Although most cases manifest as solitary tumors, desmoids occur as multicentric (either synchronous or metachronous) masses in approximately 10–15% of cases. They have an aggressive behavior with rapid tumor growth and infiltration of neighboring tissues, and the local recurrence rate after surgery is high (Robbin et al. 2001). Desmoids preferentially arise in the lower limb along the course of the sciatic nerve, in the limb girdle, and in the shoulder area. The term “desmoid” means a “tendon-like” lesion: in fact, the lesion is composed of arrays of fibroblasts and varying amounts of dense collagen. After their initial growth, most desmoids evolve into a progressive shrinkage of the mass, with a decrease in cellularity and volume of the extracellular spaces until they become an irregularly shaped mass of dense collagen tissue (Vandervenne et al. 1997). Accordingly, the MR imaging signal intensity pattern of desmoids varies with time, likely reflecting the different proportions of cellular tissue, myxoid tissue, and collagen (Vandervenne et al. 1997). Scant experience is reported in literature on the US features of extra-abdominal desmoids: these masses usually extend along the fascia and engulf muscle fibres, have variable echogenicity (depending on the degree of cellularity, water content and collagen), and ill-defined or sharp boundaries (Fig. 28a–c) (Mantello et al. 1989; Casillas et al. 1991). A faint fibrillar echotexture and posterior acoustic attenuation reflecting dense collagen tissue is often detected. Doppler imaging may demonstrate both a hypervascular and a hypovascular pattern: in general, lesions with abundant collagen are hypovascular. Although strikingly similar to other types of extra-abdominal desmoids in terms of both their histopathologic and imaging features, desmoid tumors of the abdominal wall are considered a distinct entity due to their definite relationship with women taking birth control pills (estrogen-sensitive tumor), pregnancy (during or following), abdominal surgery, and trauma. In addition, they may be part of the familial Gardner syndrome. These tumors most commonly arise in the rectus abdominis and oblique external muscles (Fig. 28d,e) (Robbin et al. 2001).
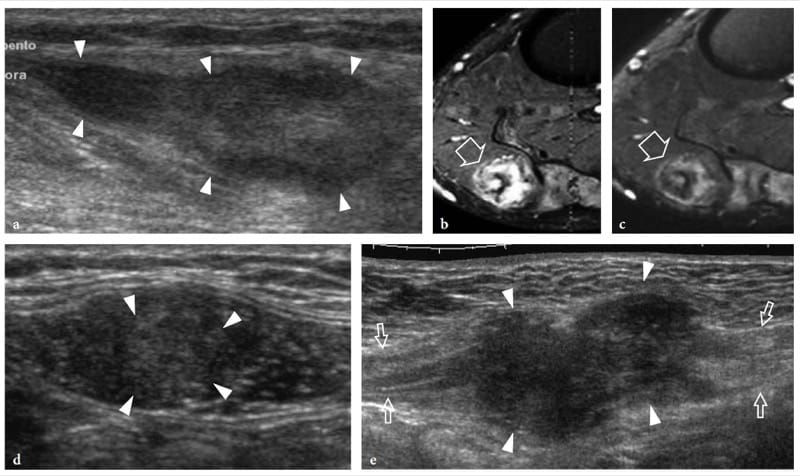
Figure 28. a–e. Intramuscular desmoids: spectrum of US appearances. a–c Extra-abdominal desmoid of the popliteal fossa. a Longitudinal 12–5 MHz US image over the medial head of gastrocnemius with b transverse fat-suppressed T2-weighted and c transverse gadolinium-enhanced fat-suppressed T1-weighted MR images demonstrates an intramuscular solid hypoechoic mass (arrowheads) with some faint fibrillar pattern elongated along the major axis of the gastrocnemius. At MR imaging, the mass (arrow) has heterogeneous high signal intensity on the T2-weighted image, which corresponds to increased cellularity, and is characterized by prominent bands of low signal intensity, likely related to the dense areas of collagen. d,e Desmoids of the abdominal wall. Two different cases observed in young women d taking birth control pills and e in the postpuerperal period. d Transverse 12–5 MHz US image over the left rectus abdominis muscle reveals an intramuscular ill-defined heterogeneously hypoechoic mass (arrowheads). e Longitudinal extended field-of-view 12–5 MHz US image demonstrates a large hypoechoic mass (arrowheads) with irregular margins, infiltrative growth, and aggressive behaviour arising from the right rectus abdominis muscle (arrows).
18. RHABDOMYOSARCOMA AND METASTASES
Rhabdomyosarcoma is the leading primary malignant tumor of striated muscle. It is extremely aggressive and has high potential for local invasion, early recurrence, and metastases. The tumor occurs throughout childhood and adolescence with two peaks of incidence between 2 and 6 years and 14 and 18 years. There are two main histotypes: embry2onic (botryoid) and alveolar (anaplastic), the latter more commonly arising from the muscles of the extremities and characterized by a worse prognosis (Cohen et al. 1996). The diagnostic imaging investigation of rhabdomyosarcoma is essentially based on MR imaging. With this technique, the tumor is usually isointense to muscle on T1-weighted images and has high signal intensity on T2-weighted images (McCarville et al. 1999). After gadolinium administration, heterogeneous enhancement is usually observed related to necrotic areas. The US imaging features of rhabdomyosarcoma lack specificity; in these patients, the role of US is limited to guiding percutaneous biopsy.
In clinical experience, the incidence of intra-muscular metastasis from malignant tumors is low. Many factors (e.g., contractile activity, local changes in pH and oxygenation, accumulation of lactic acid, intramuscular blood flow volume and pressure, local temperature) are claimed to possibly interfere with the intramuscular growth of secondary tumors (Williams et al. 1997). However, the real prevalence of striated muscle metastases in autopsy series of patients who harbored malignancy at the time of death is much higher (16%) than expected (Pearson 1959). The reason for such a discrepancy is probably related to the fact that these lesions are painless and may not be detected when they are small (Chen et al. 2005). Primary tumors that most often spread to skeletal muscles are carcinomas of the breast, colon, and lung (Chen et al. 2005). Although the diagnosis may be suspected based on the clinical history, US imaging lacks specificity to show the histologic origin of the tumor, which can be established only by means of needle biopsy (Fig. 29) (Rubens et al. 1997; Yang et al. 1999; Ahuja et al. 2000; Chen et al. 2005). Finally, one should remember that US-guided percutaneous procedures for biopsy and thermal ablation of abdominal tumors may cause needle-tract seeding of tumor cells in the subcutaneous tissue and the muscles of the abdominal wall (Kanematsu et al. 1997; Kim et al. 2000). This complication is not negligible and seems related to the number of needle passes and the needle size (Kim et al. 2000).
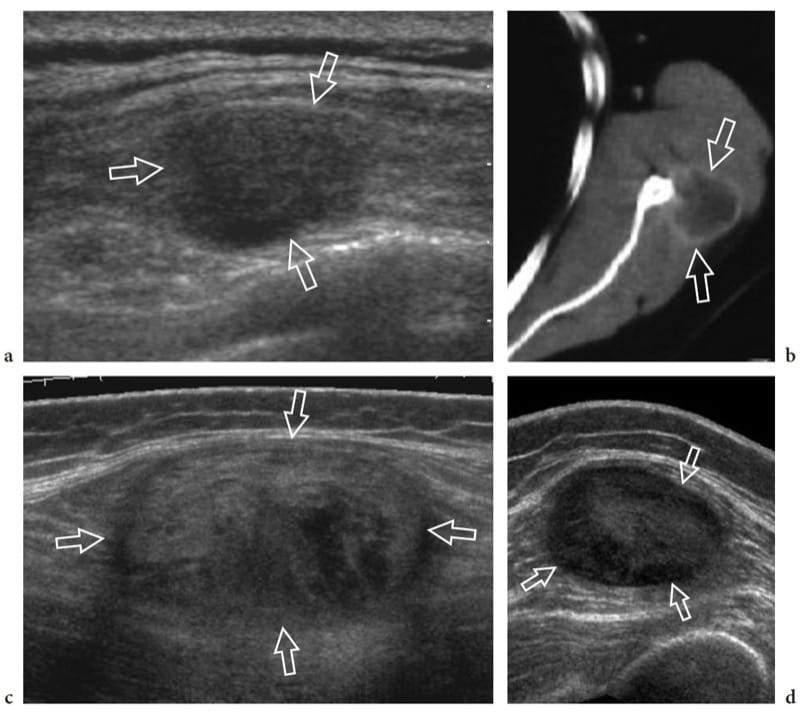
Figure 29. a–d. Intramuscular metastases: spectrum of US appearances. Three different patients with a history of malignant tumor. a Transverse 12–5 MHz US image over the left parascapular region with b CT correlation demonstrates a solid hypoechoic nodule (arrows) located within the infraspinatus muscle. Biopsy revealed melanoma metastasis. c,d Transverse 12–5 MHz US images over c the gluteal region and d the anterior thigh show well-defined oval intramuscular masses (arrows) reflecting skeletal muscle metastasis of c colonic and d renal carcinoma respectively. Note the heterogeneous appearance of skeletal muscle metastases, ranging from hypoechoic to hyperechoic nodules.
19. TENDON
Histologic Considerations
Tendons are a critical link in the musculoskeletal system, acting to connect muscle to bone. They are made of type 1 collagen (approximately 70% of dry weight) embedded in an extracellular matrix and are characterized by high tensile strength, similar to that of bone (Erickson 1997). It has been estimated that a cross-sectional area of 1 cm2 of tendon tissue is able to support a load of up to 1 tonne (Erickson 1997). In tendons, collagen has a complex arrangement, made up of highly ordered bundles of fibers grouped into fascicles. Most fibers have a course longitudinal to the tendon axis; some, however, may assume transverse and spiral arrangements (Sharma and Maffulli 2005). This configuration of collagen leads to the higher tensile strength and reinforcement of the attachment sites of tendon. Endotendineum and peritendineum – composed of loose connective tissue, elastic fibers, and small vessels – envelop the collagen bundles and are in continuity with the epitendineum, a dense connective tissue layer tightly bound to the outer tendon surface.
Tendons can be divided into two main classes: tendons with a straight path (type 1) and tendons that redirect their course across synovial joints before reaching their insertion (type 2). These two types have different envelopes in order to reduce friction during movements. Type 1 tendons are surrounded by the paratenon, a loose areolar and adipose tissue envelope that provides vessel pedicles entering the tendon substance at intervals along the tendon length and distributing longitudinally within the endotendineum (Fig. 30a). The paratenon blends with the epitendineum to form the peritendon. Type 2 tendons are covered by a synovial sheath with a cell lining identical to the synovium (Fig. 30b). This sheath is a complex structure composed of two interconnecting layers: an internal, visceral one covering the epitendineum and an external, parietal layer in continuity with the adjacent connective spaces (Erickson 1997). The sheath is infolded by the tendon, so that both visceral and parietal layers are connected by a mesotendon that provides a route for the blood supply. The virtual cavity formed by these layers contains a small amount of fluid that facilitates frictionless gliding of the tendon inside the sheath. Within osteofibrous tunnels or across joints, tendons with a synovial sheath are retained in their proper anatomic location by retinacula, consisting of focal transverse thickenings of the deep fascia attached at both ends to bony prominences (Fig. 30c).
Based on the tendon-to-bone angle and mobility, tendon attachments to bone (enthesis) can be either fibrous or fibrocartilaginous (Erickson 1997). In general, tendons that control motion in more than one plane and insert nearly perpendicularly into bone (e.g., the Achilles tendon) have a thick fibrocartilaginous attachment in order to minimize tendon fraying (Erickson 1997). Peritendinous bursae, interposed between the preinsertional portion of tendons with paratenon and bony surfaces or skin, minimize the friction among these structures during joint motion. Sesamoids, either chondral or osseous, may be encountered in tendons that are closely applied to bone. Some of them (e.g., os peroneum) may be injured in association with the tendon tear (Brigido et al. 2005).
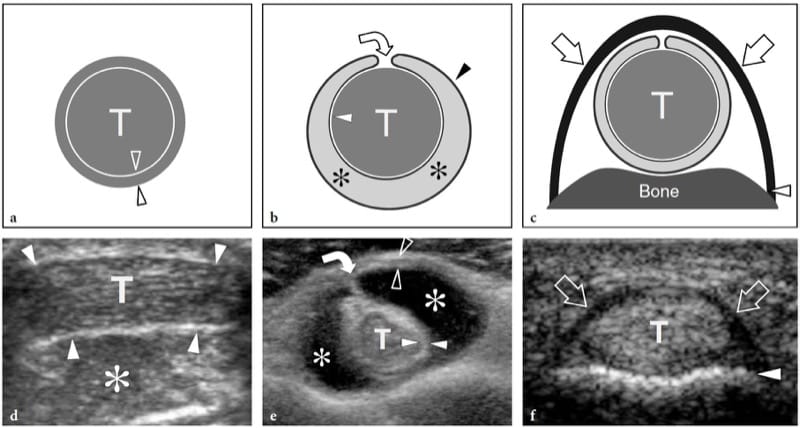
Figure 30. a–f. Tendon envelopes and retinacula. a Schematic drawing and d corresponding short-axis 12–5 MHz US image of a type 1 tendon (T) invested by paratenon. In the US image, the peritendon (arrowheads) is demonstrated as a thin hyperechoic envelope that can be distinguished from the surrounding fat (asterisk). b Schematic drawing and e corresponding short-axis 12–5 MHz US image of a type 2 tendon (T) invested by synovial sheath in patient with serous tenosynovitis. The presence of anechoic synovial effusion (asterisks) allows accurate depiction of the synovial sheath, which consists of a combination of visceral (white arrowheads) and parietal (open arrowheads) layers, and the mesotendon (curved arrow). c Schematic drawing and f corresponding short-axis 12–5 MHz US image of the fl exor digitorum tendons (T) of the fingers shows the normal appearance of an annular pulley (arrows), a retinaculum which prevents bowstringing of the underlying tendons during flexion of the fingers. Note that the superficial portion of the pulleys has a hyperechoic, fibrillar appearance due to the perpendicular incidence of the US beam, whereas its lateral portions are hypoechoic as a result of anisotropy. Arrowhead, phalangeal bone.
20. NORMAL US ANATOMY AND SCANNING TECHNIQUE
Successful US examination of tendons can be carried out with almost any US equipment that has a range of linear high-frequency transducers of 5 to 13 MHz available, the optimal US frequency being related with patient’s body habitus and depth of tendon examined. US evaluation of normal tendons along their long axis shows an internal network made up of many fine, tightly packed linear echoes which resemble a fibrillar pattern (Fig. 31a) (Fornage 1986; Fornage and Rifkin 1988; Martinoli et al. 1993). These echoes are specular reflections of the US beam and become more clearly visible and better separated one from another as the transducer frequency increases. At higher frequencies, fibrils have a higher reflectivity and become thinner and more numerous (Martinoli et al. 1993). On short-axis planes, US demonstrates the normal tendon echo-texture made up of bright stippled clustered dots instead of the linear fibrillar echoes (Fig. 31b). Histologic correlation has demonstrated that the linear echoes visible within tendons depend on the acoustic interfaces at the boundaries of collagen bundles and endotendineum septa, based on their different histologic composition (Fig. 31c) (Martinoli et al. 1993). Given the highly ordered structure of superimposed planes of collagen and septa, tendons are strongly anisotropic structures at US examination, and the fibrillar echoes can be demonstrated with efficiency only when the US beam is perpendicular to them (Fornage et al. 1987; Fornage and Rifkin 1988). Even a slight obliquity of the angle of incidence can result in an artifactual decreased echogenicity which may obscure textural details and even mimic tendinous disease (Fig. 31d,e). In practice, this occurs if a curved rather than linear-array transducer is used, or when tendons with a curvilinear shape (i.e., rotator cuff) or oblique orientation to the skin surface (i.e., distal biceps tendon) are examined. The epitendineum can be seen as a reflective line surrounding the tendon. Tendons which derive from one muscle have a uniform fibrillar pattern. Additional intratendinous details may be appreciated in tendons which originate from one or more muscles. In the Achilles tendon, for instance, the convergent contributions from the two heads of the gastrocnemius and the interface between them (posterior) and the soleus (anterior) can be visualized as central thickened echoes due to the union of respective peritendinous envelopes (Bertolotto et al. 1995); in the quadriceps tendon, a trilaminar complex made up of distinct superficial (from rectus femoris), intermediate (from vastus medialis and lateralis), and deep (from vastus intermedius) layers can be seen to unite in a common trunk (Bianchi et al. 1994a). As regards tendon envelopes, the para-tenon appears as an undefined hyperechoic tissue in continuity with subcutaneous fat, and provides vessel pedicles entering the tendon substance at intervals along the tendon length and distributing longitudinally within the endotendineum (Fig. 30d). In normal conditions, US demonstrates the synovial sheath as a thin hypoechoic rim surrounding the tendons, due to a film of fluid contained within the synovial space. The complex anatomy of the sheath can be better delineated in cases of tenosynovial effusion, when the synovial space is distended by a larger amount of fluid (Fig. 30e).
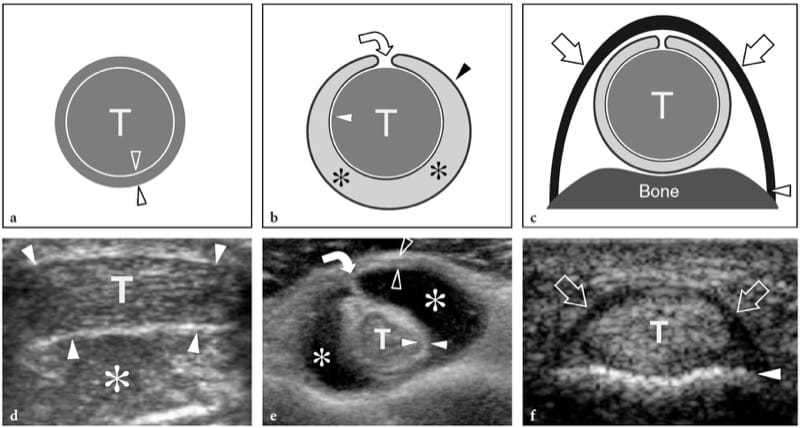
Figure 30. a–f. Tendon envelopes and retinacula. a Schematic drawing and d corresponding short-axis 12–5 MHz US image of a type 1 tendon (T) invested by paratenon. In the US image, the peritendon (arrowheads) is demonstrated as a thin hyperechoic envelope that can be distinguished from the surrounding fat (asterisk). b Schematic drawing and e corresponding short-axis 12–5 MHz US image of a type 2 tendon (T) invested by synovial sheath in patient with serous tenosynovitis. The presence of anechoic synovial effusion (asterisks) allows accurate depiction of the synovial sheath, which consists of a combination of visceral (white arrowheads) and parietal (open arrowheads) layers, and the mesotendon (curved arrow). c Schematic drawing and f corresponding short-axis 12–5 MHz US image of the flexor digitorum tendons (T) of the fingers shows the normal appearance of an annular pulley (arrows), a retinaculum which prevents bowstringing of the underlying tendons during flexion of the fingers. Note that the superficial portion of the pulleys has a hyperechoic, fibrillar appearance due to the perpendicular incidence of the US beam, whereas its lateral portions are hypoechoic as a result of anisotropy. Arrowhead, phalangeal bone.
At the tendon ends, the attachment to muscle is gradual and appears as a crowding of the muscular fibers, with rapid reduction in the volume of the muscle, whereas the attachment to bone is abrupt and includes a narrow hypoechoic band facing the bone cortex due to the interposition of fibrous tissue or fibrocartilage. In some tendons, the insertion to bone may be more prominent in subjects who are physically active. Depending on fiber-to-bone angle, anisotropy can artifactually increase the extent of this zone as the tendon fibers change from a horizontal to a more vertical alignment as they approach their insertion. Retinacula appear as thin anisotropic laminar bands transversely oriented over the long axis of the tendon (Fig. 30f). Identification of an intervening hypoechoic space or dynamic scanning make differentiation of fixed retinacula from gliding tendons easier.
Depending on the site examined, proper transducer positioning perpendicular to the tendon examined should be reached by either changing the transducer’s obliquity, or moving the joint examined while keeping the transducer fixed or inducing tension in the examined tendon by active contraction of the muscle. Flexible stand-off pads or generous amounts of gel must be used for assessment of tendons that wrap around curvilinear joint surfaces. However, when bony prominences or narrow spaces preclude an adequate alignment of the probe on the long axis of tendon, US evaluation may be performed on short-axis planes. Although these planes do not allow depiction of the linear fibrillar echoes, tendons may reliably be identified as well, based on the critical variation in their echogenicity that can be induced by rocking the probe back and forth. Systematic scanning on short-axis planes has the further advantage of better depicting the relationships of tendons with adjacent structures, as well as confirming the presence and extent of pathologic findings. In addition, when multiple tendons run adjacent one to the other through a restricted space or across a joint, it is easier to distinguish each individual tendon on short-axis planes. Dynamics of tendon motion during joint activity or muscle contraction can be evaluated with US in real time, and this may be essential to rule out tendon abnormalities, to differentiate partial from complete tears, as well as to assess the status of a postoperative tendon.
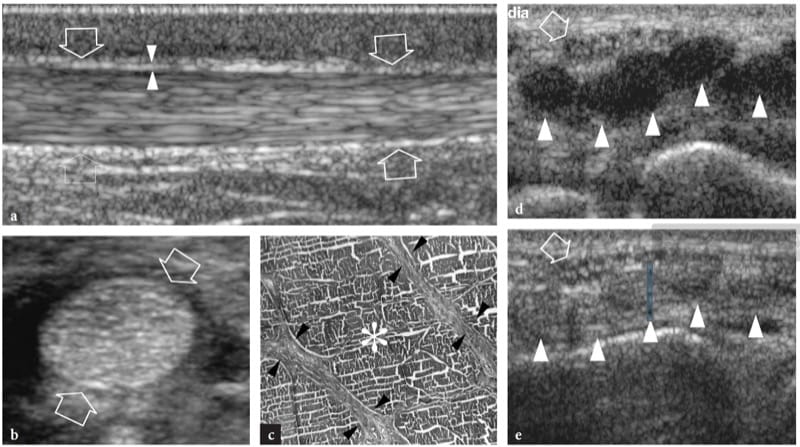
Figure 31. a–e. Tendon echotexture and anisotropy. a Long-axis 12–5 MHz US image of the normal Achilles tendon (arrows) demonstrates numerous echogenic intratendinous interfaces, resulting in the typical fibrillar appearance. Owing to the use of a linear array transducer, depiction of fibrillar echoes is quite homogeneous throughout the entire US image, without hypoechoic areas caused by anisotropy. The paratenon appears as a hyperechoic envelope (arrowheads) in continuity with the subcutaneous fat. b Short-axis 17–5 MHz US image of the normal flexor pollicis longus tendon (arrows)shows a homogeneous intratendinous pattern made of bright stippled clustered dots. c Histologic specimen shows the fine structure of tendons made of parallel endotendineum septa (arrowheads) which cross collagen fibers (asterisk). d,e Tendon anisotropy. Transverse 12–5 MHz US images of the flexor tendons at the wrist obtained with an angle of incidence of the US beam d different or e equal to 90°. d An artifactual hypoechoic appearance is obtained when tendons (arrowheads) are imaged with the US beam at an inappropriate angle. As shown in e, this is in contrast to the normal hyperechoic fibrillar appearance displayed when the US beam is perpendicular to the tendon axis. Note that the fascicular structure of the median nerve (arrow) is always apparent regardless of angle of incidence, because nerves do not exhibit anisotropy.
21. TENDON INSTABILITY
Dislocation occurs in tendons invested by synovial sheath, following the injury of one or more restraining structures of an osteofibrous tunnel, such as ligaments, retinacula, and annular pulleys. A wide spectrum of mechanical injures, ranging from violent acute trauma to repetitive minor damage may lead to instability of certain tendons as they reflect within osteofibrous tunnels: congenital hypoplasia of the bony groove or laxity of the fibrous roof of the tunnel may predispose to tendon instability (Fig. 32a). US evaluation may reveal the degree of tendon instability (i.e., intermittent subluxation, permanent subluxation, dislocation) as well as a number of associated findings, such as peritendinous effusion related to tenosynovitis or lesions in the tendon substance due to abnormal friction of the displaced tendon against bony edges (Fig. 32b,c). Dynamic examination may enhance detection of intermittent subluxation and assess whether spontaneous reduction is possible. The dynamic imaging afforded by US appears to be well suited for such evaluation, especially in cases of subluxation, where this technique is more efficient and easier than MR imaging obtained with varied positioning. Permanent dislocations may readily be identified on static scans, whereas intermittent subluxation requires dynamic examination to assess whether spontaneous reduction is possible. Systematic scanning on short-axis planes is preferred for assessing the instability of tendons, because both the empty tunnel and the displaced tendon can be demonstrated in a single image. In the appropriate chapters, peculiar US features are described in detail for the instability of the long head of the biceps tendon (Farin et al. 1995; Ptasznik and Hennessy 1995; Prato et al. 1996; Martinoli et al. 2003), the peroneal tendons (Fessell et al. 1998; Magnano et al. 1998; Neustadter et al. 2004), the posterior tibial tendon (Prato et al. 2004), and the flexor (Klauser et al. 1999; Hauger et al. 2000; Martinoli et al. 2000; Klauser et al. 2002; Martinoli et al. 2005) and extensor (Lopez-Ben et al. 2003) tendons of the fingers (Fig. 32d,e).
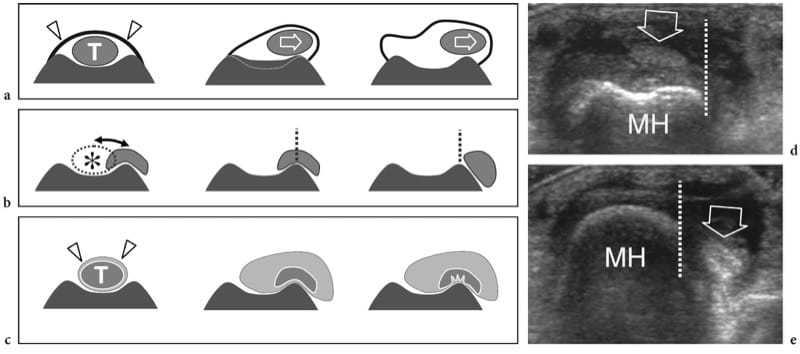
Figure 32. a–e. Tendon instability. a Schematic drawings illustrate congenital causes of tendon instability. On the left, the tendon (T) is stabilized within its bony groove by a retinaculum (arrowheads). Tendon instability can be observed in cases of flat bony groove (center) or laxity of the retinaculum (right). b Schematic drawings illustrate the different grades of instability of a tendon relative to its bony groove (asterisk): intermittent subluxation (left), permanent subluxation (center) or dislocation (right). The boundary of the groove is indicated by the vertical dashed line. c Schematic drawings illustrate the main abnormalities occurring in tendons (T) invested by a synovial sheath (arrowheads) during subluxation, including reactive tenosynovitis (center) and partial tear (right). d,e Intermittent subluxation of finger extensor tendon. Transverse 12–5 MHz US images of the knuckle of the middle finger in a patient with injury to the metacarpophalangeal joint and rupture of the sagittal band, acquired d while the hand was extended and e in the clenched fist position. With the finger extended, the extensor tendon (arrow) lies in a normal position with respect to the dorsal metacarpal head (MH); with the fist clenched, there is anterior dislocation of the tendon on the ulnar side of the bone (dashed-line).
22. DEGENERATIVE CHANGES AND TENDON TEARS
In an intact musculotendinous system, tendon ruptures are infrequent and typically develop at the insertion of tendon into bone, with or without avulsion of a small osseous fragment, or at the myotendinous junction, as a result of significant trauma or an excessive rate of loading. On the contrary, given the tough, fibrous nature of tendons, intrasubstance ruptures rarely occur outside the setting of predisposing degenerative changes that weaken the strength of the tendinous structure (Kainberger et al. 1997). Several theories have attempted to explain the degenerative process in tendons. Intrasubstance degeneration may derive from overuse injures, such as occur in certain sports (i.e., swimming, golf, tennis, running, basketball, and ballet dancing) in which repetitive submaximal loading and/or eccentric mechanical forces create recurrent microtrauma with microfailure of collagen bundles that do not heal completely, especially in the vulnerable areas where tendons exhibit reduced blood flow (Herring and Nilsson 1987). The supraspinatus, long head and distal biceps, extensor and flexor tendons about the elbow, patellar and Achilles tendons, tibialis posterior and flexor hallucis longus tendons are more frequently involved by overuse damage. However, constriction or compression behind a retinaculum as well as excessive frictional forces against bony surfaces or adjacent accessory tendons can contribute to tendon damage at other levels also (Fessell and van Holsbeeck 1999). In addition, abuse or local injection of corticosteroids and systemic disorders, such as systemic lupus erythematosus, gout, rheumatoid arthritis, diabetes, hyperparathyroidism, and chronic renal failure, can cause a detrimental effect on the strength of tendons and predispose them to rupture. The quadriceps and patellar tendons, the extensor and flexor digitorum tendons and the posterior tibial tendon are primarily involved by systemic disorders. Most likely, some combination of trauma and predisposing factors, either mechanical or biochemical, is the initial cause of the degenerative process in tendons (Campbell and Grainger 2001). Then, a continuum exists with degenerative changes and minor intrasubstance tear leading to partial and complete rupture (Jacobson and van Holsbeeck 1998).
23. TENDINOSIS AND PARTIAL TEARS
Although painful tendinopathy is often called “tendinitis,” this term is actually a misnomer. In fact, these tendons are characterized by a degenerative noninflammatory process that is best termed “tendinosis” (Khan et al. 1996; Campbell and Grainger 2001). From the histopathologic point of view, the damage to collagen which occurs in tendinosis derives mainly from hypoxic and myxoid degeneration and leads to deposition of interfibrillar glucosaminoglycans (Khan et al. 1996; Movin et al. 1997; Schweitzer and Karasick 2000). The first process is likely caused by ischemia because of critical zones of hypovasculature in tendons; the second reflects deposition of large mucoid patches and vacuoles between the thinned degenerated fibers. In most patients, the two processes coexist and are associated with spontaneous tendon rupture (Schweitzer and Karasick 2000).
As regards the location of the degenerative areas, the increased risk of certain anatomic sites for development of tendinosis has led to the concept of critical zones, in which several factors, such as aging, hypovascularization, and biomechanical effects in combination with repetitive trauma, play a specific causative role (Kainberger et al. 1997; Schepsis et al. 2002). In the Achilles tendon, for example, the predominant involvement of its middle third has been attributed to the fact that this is an area of low vasculature at the watershed between two separate vascular networks which converge toward the middle from the myotendinous and the teno-osseous junction (Kainberger et al. 1997). Other biomechanical factors may be implicated in the involvement of the middle third of the Achilles tendon, such as the difference in tension between the gastrocnemius and soleus fibers, which fuse to become one tendon only about 5–6cm from the calcanear insertion (Kainberger et al. 1997). Then, the fibers around the medial portion of the tendon are specifically involved in patients with hyperpronation of the foot, such as subjects with marked forefoot varus, due to eccentric shear forces across medial tendon fibers (Fig. 33a) (Gibbon et al. 2000). On the other hand, in distal third Achilles tendinopathy, abnormalities most often involve the deep tendon surface as a probable result of the biomechanical conflict between these fibers and the posterosuperior angle of the calcaneus in full dorsiflexion (Fig. 33b) (Gibbon et al. 2000). In “jumper’s knee,” the deep central portion of the proximal insertion of the patellar tendon is most often involved: somewhat similar to insertional Achilles tendinopathy, micro-trauma occurring between the undersurface of the patellar insertion and a prominent patellar tip has been assumed to be a causative factor for chronic impingement and development of secondary degenerative changes (Khan et al. 1996). At the elbow, in the common extensor tendon, the fibers of the extensor carpi radialis brevis lie deep, just over the lateral ulnar collateral ligament, whereas the contribution from the extensor digitorum communis is superficial. Based on such anatomic consideration, some authors have speculated that the most common abnormalities of lateral epicondylitis involve the origin of the extensor carpi radialis brevis and, to a lesser extent, the anterior aspect of the extensor digitorum tendon (Connell et al. 2001).
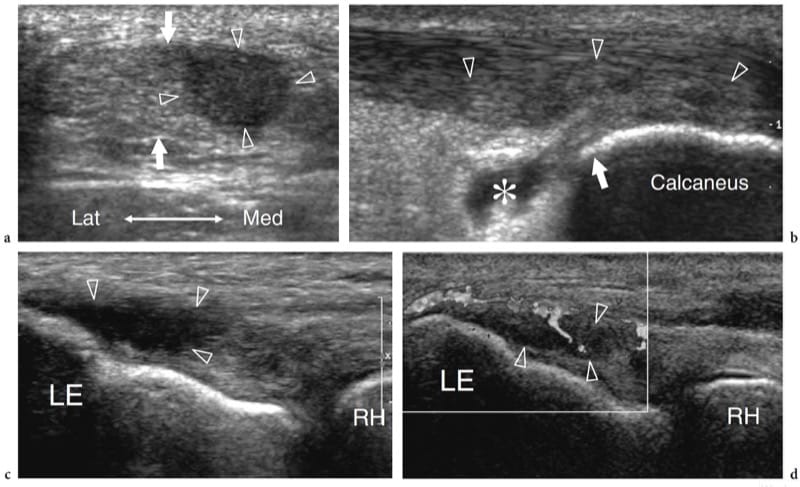
Figure 33. a–d. Tendinosis: spectrum of US appearances. a Short-axis 12–5 MHz US image over the middle third of the Achilles tendon (arrows) in a 35-year-old man with marked hyperpronation of the foot demonstrates selective involvement of the medial tendon fibers (arrowheads). b Long-axis 12–5 MHz US image of the distal third of the Achilles tendon reveals selective involvement the deep tendon fibers (arrowheads) and retrocalcaneal bursitis (asterisk) probably as a result of chronic conflict with the posterosuperior angle (arrow) of the calcaneus during dorsiflexion. c,d Long-axis c gray-scale and d color Doppler 17–5 MHz US images of the common extensor tendon attachment on the lateral epicondyle (LE) in a 40-year-old tennis player demonstrate focal hypoechoic intratendinous changes and disappearance of the fibrillar echoes (arrowheads), signs that are typical of lateral epicondylitis. Color Doppler imaging reveals a hypervascular pattern in the intratendinous hypoechoic area. RH, radial head.
From the clinical point of view, tendinosis typically presents with tendon swelling, tenderness, and absent or moderate pain aggravated by activities and the coexistence of tenosynovitis (Fornage and Rifkin 1988; Schepsis et al. 2002; Premkumar et al. 2002). US demonstrates degenerative changes as focal (nodular) or diffuse tendon thickening, and intratendinous hypoechoic areas with loss of the fibrillar echoes, reflecting a disorganized structure of the collagen bundles (Fig. 33a–c) (Fornage et al. 1984; Maffulli et al. 1990b; Martinoli et al. 1993; Åström et al. 1996; Grassi et al. 2000). As US technology progresses, new developments in signal-processing software, such as compounding technology, are leading to a continuing improvement of image contrast and detail resolution. The result is an improved delineation of fine pathologic findings within degenerated tendons. This contributes to a more confident differentiation between normal and pathologic states and to a more reliable use of this technique. Care must be taken, however, in determining the true pathologic meaning of these subtle changes in the tendon substance, since minor abnormalities can be found also in asymptomatic tendons of aged individuals (Martinoli et al. 1999).
Abnormally thickened tendons with altered echotexture (focal hypoechoic areas) may exhibit a hypervascular pattern at color and power Doppler imaging (Fig. 33d) (Weinberg et al. 1998; Öhberg et al. 2001; Terslev et al. 2001; Richards et al. 2001, 2005; Silvestri et al. 2003). Tendinosis-related neovasculature is typically appreciated in relation to the thickened part of the tendon, both inside and outside it (Öhberg et al. 2001; Peers et al. 2003). It appears significantly enhanced by activity of the tendon before imaging (Cook et al. 2004). As regards the significance of increased blood flow within tendons, a positive correlation seems to exist between the overall number of vessels detectable and the tendon size; painful tendinosis typically appears more hypervascular than asymptomatic tendinosis, whereas no correlation has been found between microvascular response and duration of symptoms (Öhberg et al. 2001; Richards et al. 2005). In any case the meaning of the hypervascular pattern – whether it is causative of tendon abnormalities or secondary to attempts at healing – has yet to be defined (Richards et al. 2005). In terms of patient outcome, a hypervascular pattern detected at color and power Doppler imaging is not an unfavorable sign (Zanetti et al. 2003); as seen on gray-scale US, tendon heterogeneity seems more likely related to a worse clinical outcome after conservative treatment (Nehrer et al. 1997; Archambault et al. 1998). US-guided interventional procedures to treat chronic painful tendinosis.
Tendon heterogeneity on gray-scale US images does not necessarily mean tendinosis-related changes, but it may also reflect a partial tendon tear (Martinoli et al. 1999; Jacobson et al. 1999). An abrupt demarcation between degeneration, micro-tears, and interstitial tears is misleading, because these forms reflect, in themselves, a continuum of the same disease process and, in many cases, coexist and are treated identically (Campbell and Grainger 2001). With progress in US technology, interstitial tears can be identified in areas of tendon degeneration as thin hypoechoic clefts oriented along the long axis of the tendon and possibly reaching the tendon surface (Figs. 34, 35) (Connell et al. 2001; Campbell and Grainger 2001; Premkumar et al. 2002). Progressive tearing leads to contour irregularities or focal thinning (Chen and Liang 1997). Partial tears occur in the longitudinal orientation, parallel to the course of the tendon (longitudinal splits, fissurations) or in the transverse direction, perpendicular to the tendon fibers (Diaz et al. 1998; Bianchi et al. 2005, 2006). On a more macroscopic level, partial tendon tear may involve macroscopic amounts of fibers, and even produce discontinuities in individual portions of complex tendons (Bianchi et al. 1994a). US evaluation demonstrates both the intact and the retracted ruptured portions of tendon in association with a hematoma (Kalebo et al. 1990, 1992). The longitudinal fibrillar pattern is lost in the fractured part of the involved tendon, but it remains unaffected in the intact part (Fig. 35a,b) (Martinoli et al. 1993). Lack of tendon retraction is the most important feature for distinguishing partial from complete rupture.
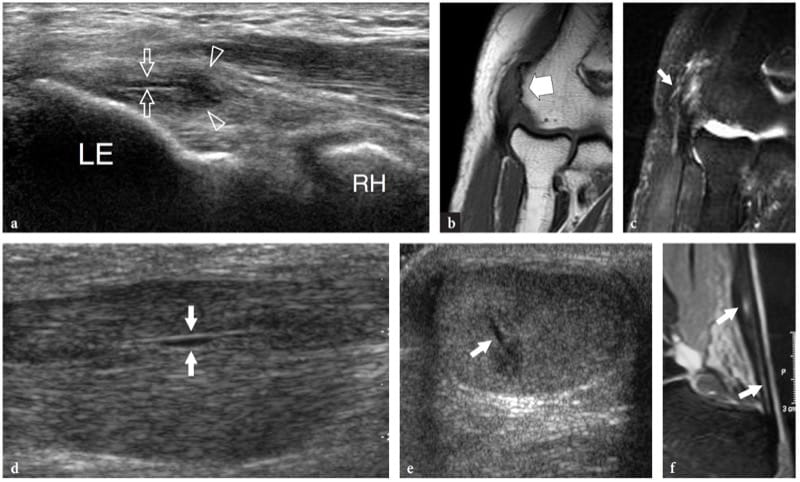
Figure 34. a–f. Intratendinous longitudinal splits. Two different cases. a Long-axis 17–5 MHz US image of the common extensor tendon insertion in a patient affected by severe lateral epicondylitis with coronal b T1-weighted and c fat-suppressed T2-weighted MR imaging correlation shows an intratendinous fluid-filled linear tear (arrows) extending from the bone insertion distally. Note that the longitudinal tear has developed within a focal hypoechoic area (arrowheads) of tendon degeneration LE, lateral epicondyle; RH, radial head. d Long-axis and e short-axis 12–5 MHz US images over the middle third of the Achilles tendon in a patient with high-grade tendinosis reveal an intratendinous longitudinal fi ssuration (arrows). f Correlative sagittal T2-weighted MR image.
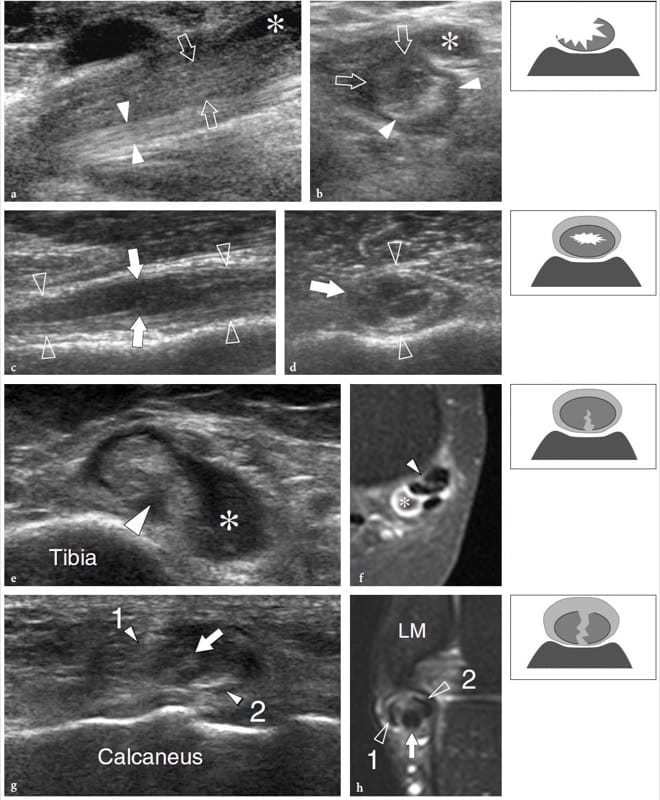
Figure 35. a–h. Partial tendon tears: spectrum of US appearances. Four different cases. a,b Partial tear of the distal biceps tendon. a Long-axis and b short-axis 17–5 MHz US images demonstrate a swollen tendon characterized by a superficial hypoechoic half (arrows) reflecting the torn fibers and an intact posterior half (arrowheads) with normal fibrillar echotexture. Asterisk, bicipitoradial bursitis. c,d Partial tear of the long head of the biceps tendon. c Long-axis and d short-axis 12–5 MHz US images reveal a swollen tendon (arrowheads) containing a well-defined fluid-filled cavity (arrows) which extends along the long tendon axis, reflecting a central fissuration. The examiner should be aware that such intrasubstance tears are not visible by direct inspection of the surface of the tendon during arthroscopy or open surgery. e,f Partial tear of the tibialis posterior tendon. e Transverse 12–5 MHz US image obtained in the supramalleolar area with f gadolinium-enhanced fat-suppressed T1-weighted MR imaging correlation shows a peripheral longitudinal tear (arrowhead) of the tibialis posterior tendon involving its deep surface, associated with tenosynovial fluid (asterisk). g,h Partial tear of the peroneus brevis tendon. g Short-axis 12–5 MHz US image obtained in the inframalleolar area with h fat-suppressed T2-weighted MR imaging correlation demonstrates a bisected peroneus brevis divided into two halves (1, 2). The intact peroneus longus tendon (arrow) insinuates into the tear of the peroneus brevis. The presence of synovial effusion makes detection of the tear easier. LM, lateral malleolus. The sketches at the upper right of the figure indicate the different types of partial tendon tears.
In specific clinical settings, tendons may be involved by metabolic disorders. In gout, deposition of urate tophi in the Achilles tendons may result in intratendinous nodules or diffuse thickening of the tendon, while in heterozygous familial hypercholesterolemia, US can depict bilateral intratendinous xanthomas in grossly enlarged Achilles tendons as focal or diffuse hypoechoic areas before they become apparent at physical examination (Kainberger et al. 1993; Bude et al. 1993, 1994, 1998; Bureau et al. 1998). This condition closely mimics high-grade hypoxic tendinosis. Calcifications may infrequently be encountered in tendons, although their relationship with tendon degeneration is unclear. Calcific deposits appears as linear echoes located preferentially at the insertion of tendon into bone (enthesis), reflecting a process of calcium hydroxyapatite or calcium pyrophosphate dihydrate crystal deposition. In predisposed subjects, extensive plaque-like ossification may occur after severe repetitive trauma in the middle third of the Achilles tendon (Fig. 36) (Yu et al. 1994; Hatori et al. 2002). In these instances, an intratendinous process of enchondral and intramembranous ossification is found (Hatori et al. 2002).
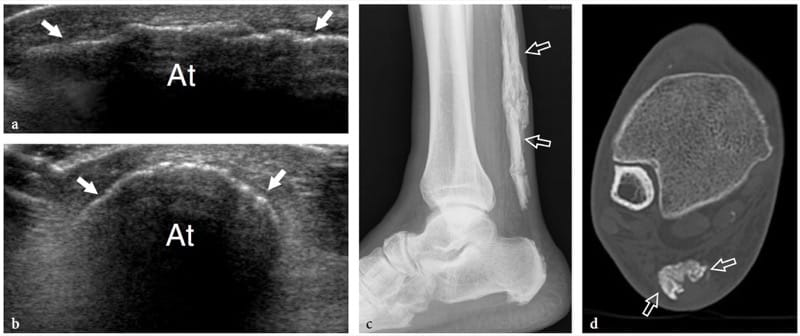
Figure 36. a–d. Intratendinous ossification. a Long-axis and b short-axis 12–5 MHz US images of the Achilles tendon (At) with c radiographic and d CT correlation reveal an extensive plaque-like intratendinous ossification (arrows). At CT, the intratendinous ossification demonstrates mature lamellar bone formation.
24. COMPLETE TEARS AND POSTOPERATIVE FINDINGS
The clinical diagnosis of complete tendon tears is usually less challenging than that of partial tendon tears. However, other tendons can compensate, to some degree, for an injured tendon, and soft-tissue edema may obliterate the tendon defect in an acute tear, thus rendering physical examination non-diagnostic (Hartgerink et al. 2001). When the clinical examination is equivocal, US examination may help to avoid a delayed diagnosis (Åström et al. 1996; Hartgerink et al. 2001). This is essential because tendons retract with time, making retrieval and reattachment more complicated. Generally speaking, US evaluation allows a precise assessment of the severity and extent of tendon injury. In particular, distinguishing tendinosis and partial tears usually from a complete tendon rupture is of the utmost importance, given the fact that most complete tears require surgery whereas partial tears or tendinosis are managed conservatively with surgical repair undertaken only after a failure of conservative treatment (Saltzman and Tearse 1998). US demonstrates acute complete rupture of a tendon as a focal defect created by a variable degree of retraction of the torn tendon edges (Fig. 37) (Fornage and Rifkin 1988; Teefey et al. 1999; Bianchi et al. 1994b; Farin 1996). Posterior acoustic shadowing at the site of tendon tear or behind the retracted tendon stump may be an associated finding as a result of sound-beam refraction at the frayed tendon ends (Fig. 38) (Kainberger et al. 1990; Hartgerink et al. 2001). The defect created by the tear is usually filled with anechoic or hypoechoic fluid from local hematoma. When the tendon sheaths are also ruptured, the hematoma is usually larger and has irregular and indistinct margins. In subacute and chronic tearing, the absence of fresh hemorrhagic fluid and the organized hematoma which fills the defect with echogenic material can be misleading, mimicking tendon integrity (Fig. 39). In synovial sheath tendons, an accurate scanning technique may be required to visualize the tendon ends, which can be retracted at a variable distance from the site of the tear, and to measure the amount of tendon retraction on longitudinal scans. If there is no retraction and the torn tendon ends are curled up, or if fluid does not fill the space created by the tear, gentle passive assisted movements can be helpful to enhance the separation of the tendon ends during stretching (Kainberger et al. 1997).

Figure 37. a,b. Complete tendon tear. a Long-axis 12–5 MHz US image over the quadriceps tendon with b fat-suppressed T2-weighted MR imaging correlation shows a transverse hypoechoic gap in the tendon substance filled with fluid (asterisks) between the proximal and distal ends (arrows), consistent with a complete rupture. Note that the tendon tear forms a communication between the joint and the prepatellar bursa. P, patella.
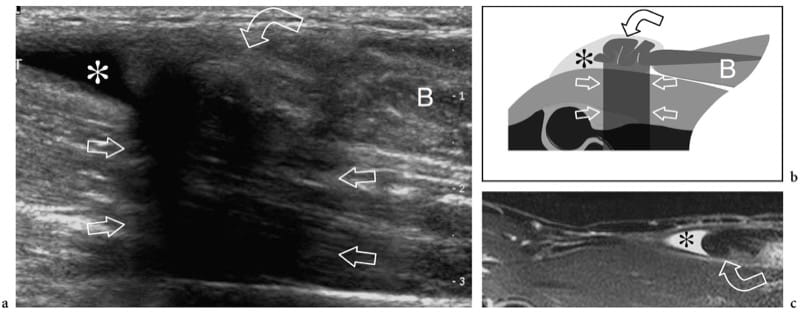
Figure 38. a–c. Complete tendon tear. a Long-axis 12–5 MHz US image over the anterior elbow with b schematic drawing and c sagittal fat-suppressed T2-weighted MR imaging correlation shows a fluid-filled defect (asterisk) and the retracted proximal tendon end (curved arrow) of a ruptured distal biceps tendon. The tendon is shrunk and characterized by posterior acoustic attenuation (straight arrows), findings that are consistent with a complete tear. Note the retracted myotendinous junction of the biceps muscle (B).

Figure 39. a,b. Chronic nonoperated Achilles tendon tear. a Long-axis extended field-of-view 17–5 MHz US image over the posterior ankle in a patient who suffered an acute Achilles tendon rupture 1 year previously as a result of a bicycling injury with b sagittal T1-weighted MR imaging correlation demonstrates a gap of approximately 6 cm between the proximal (star) and distal (asterisk) blunt tendon ends. There is debris between the torn tendon ends and posterior herniation of the pre-Achilles fat (curved arrow) within the defect created by the tear. Note the fusiform, blunt contraction of the distal tendon segment. PM, posterior malleolus; C, calcaneus.
In a degenerative setting, intense muscle contraction or abnormal stress forces exerted on healthy tendons may lead to avulsions at their sites of insertion into bone. These tears often lead to detachment and retraction of a bony fragment which remains embedded in the tendon. Avulsion injuries typically involve the supraspinatus tendon, causing retraction of a fleck of bone from the greater tuberosity, the peroneus brevis, leading to avulsion of the base of the fifth metatarsal, the flexor and extensor digitorum tendons, which may detach a small cortical fragment from the base of distal phalanx, and the triceps tendon, leading to an olecranon fracture (Fig. 40). The size and degree of displacement of the avulsed bony fragment is variable. As avulsion fractures are most commonly encountered in children and adolescents, tendon avulsion injuries.
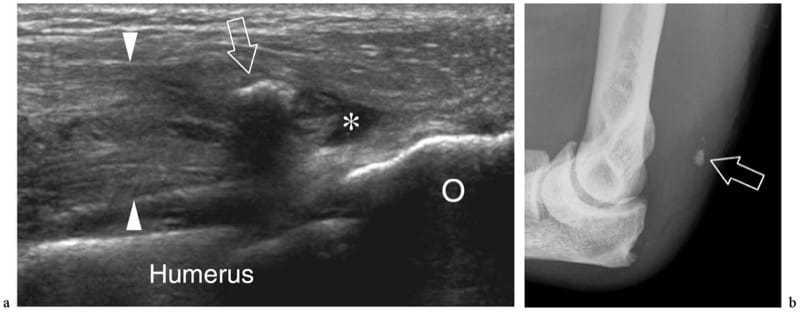
Figure 40. a,b. Acute avulsion-type injury of the medial head of the triceps tendon. a Long-axis 12–5 MHz US image over the posterior elbow with b plain film correlation demonstrates a ruptured retracted medial head of the triceps tendon (arrowheads) containing a fragment of bone (arrow) within, as a result of avulsion trauma from the olecranon process (O). The retracted, thickened proximal tendon is seen surrounded by mild hypoechoic fluid (asterisk).
After surgical repair for a tendon tear, US imaging can help to monitor the healing process as well as to rule out recurrent tears (Campbell and Grainger 2001; Müller et al. 2002). Common postoperative findings include altered tendon size with areas of thickening or thinning, regardless of the time of follow-up, and permanent abnormal echotexture at the site of the tear. Although echo-textural changes may partially regress with time, they persist for many years after surgery (Rupp et al. 1995). Heterotopic ossification may occasionally occur. In type 1 tendons (i.e., Achilles tendon), the paratenon becomes thickened and cannot be differentiated from the tendon tissue, thus leading to contour irregularities; the tendon gliding mechanism is often impaired or limited (Rupp et al. 1995). Dynamic scanning is essential in the postoperative evaluation of type 2 tendons as a means to assess tendon gliding function within the sheath and to exclude possible adhesions. Intratendinous sutures appear as bright double linear echoes (rail-like lines) due to high-amplitude reflection of the US beam with posterior reverberation artifact (Maffulli et al. 1990a; Rupp et al. 1995). After repair of avulsion injuries, suture anchors can be depicted as small defects of the cortical bone filled with bright material with posterior reverberation artifact. During the healing process, however, these signs seem to have limited value with regard to evaluation of the functional results, such as muscle strength, endurance, and range of motion (Rupp et al. 1995; Müller et al. 2002). Recurrent rupture may manifest with partial disruption of the tendon fibers up to complete breakdown of the anastomosis (Fig. 41). In these cases, tendon thickening with intratendinous hematoma or tendon thinning with abundant fluid in the tendon sheath may indicate a small recurrent tear. In complete recurrent tears, tendon discontinuity may be associated with sutures floating freely within the hematoma.
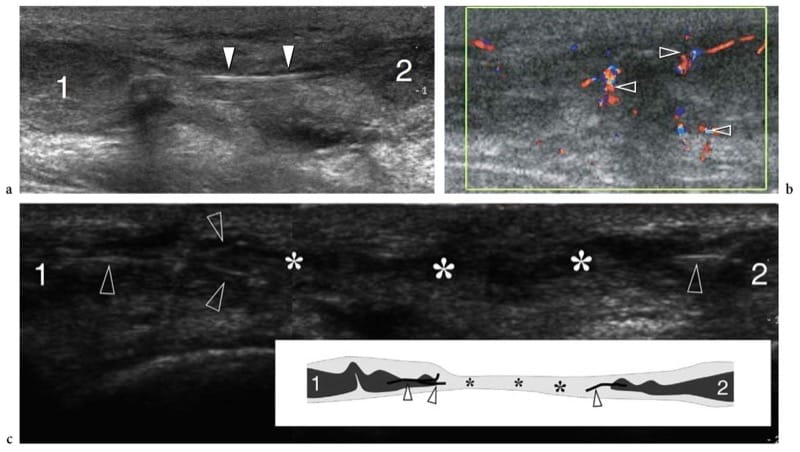
Figure 41. a–c. Postsurgical tendon retear. Two different cases. a,b Achilles tendon retear. a Long-axis gray-scale and b color Doppler 12–5 MHz US images show complete retear of a previously sutured Achilles tendon. The swollen tendon ends (1, 2) are separated by a wide gap filled with debris and fluid. Note the surgical stitches (arrowheads in a) lying free within the gap. Local blood flow signals (arrowheads in b) surround the tendon ends reflecting local hyperemia. c Extensor pollicis longus tendon retear. Long-axis 12–5 MHz US image over the dorsoradial aspect of the hand with schematic drawing correlation (insert)reveals a fluid-filled gap (asterisks) between the two retracted ends (1, 2) of the extensor pollicis longus tendon. Note the disconnected surgical stitches (arrowheads) attached to the tendon ends that float freely within the empty tendon sheath. A split-screen image was used, with the two screens aligned for an extended field of view.
25. INFLAMMATORY CONDITIONS
Although less common than degenerative processes, some pathologic conditions in tendons are actually inflammatory in nature, and distinguishing these forms from simple tendinosis is important because the clinical management may differ. Although degenerative and inflammatory conditions may be treated with the same conservative measures (i.e., rest, ice, and nonsteroidal anti-inflammatory drugs), inflammatory lesions that fail to regress require more aggressive therapy with corticosteroids or even surgical procedures. The spectrum of US findings depends on the type of tendon involved, as well as on the associated changes occurring in the tendon envelopes and associated synovial bursae. The inflammatory process mainly results in “peritendinitis” for tendons invested by paratenon (type 1) and “tenosynovitis” for tendons invested by synovial sheath (type 2). For both processes, the functional meaning is somewhat equivalent. Peculiar conditions, such as calcifying tendinitis, are addressed elsewhere.
26. PARATENDINITIS AND ATTRITION BURSITIS
Paratendinitis (peritendinitis) most often occurs in the Achilles tendon in association with high-grade hypoxic tendinosis during phases of exacerbation of disease (Fig. 42a) (Schweitzer and Karasick 2000). Clinically, paratendinitis is accompanied by diffuse discomfort and peritendinous swelling and tenderness (Schepsis et al. 2002). Fluid within and patchy thickening of the paratenon, irregularities of tendon margins, and adhesions are typically found (Gibbon et al. 2000; Martinoli et al. 1999). In the less common isolated paratendinitis (without tendinosis), the Achilles tendon itself is normal while the peritendinous tissues show edematous changes and tender nodules related to localized connective tissue hypertrophy (Fig. 42b,c). Acutely, this condition is encountered in long-distance (marathon) runners as a result of abnormal biomechanics; it may also follow training errors, including a sudden increase of exercise and change of terrain, particularly hill-running.
Paratendinous bursae (e.g., the retrocalcaneal bursa at the heel, the deep infrapatellar bursa at the knee, and the bicipitoradial bursa at the elbow) primarily act as shock absorbers by reacting to increased compression and frictional forces exerted by the overlying tendons (Gibbon and Wakefield 1999). In most cases, intrabursal fluid or synovial hypertrophy denote an inflammatory process that is mechanical in origin and occurs in proximity to the preinsertional portion of the tendon (Fig. 42d,e). If mild, fluid does not have clinical importance and reflects irritation due to local overload and work stress. Bursitis may cause local discomfort only when mechanical synovitis is excessive or when the process is combined with a joint effusion in patients with primary inflammatory arthropathies such as rheumatoid arthritis and seronegative spondyloarthropathies, or metabolic disorders such as gout (Gibbon and Wakefield 1999; Ho et al. 2003).
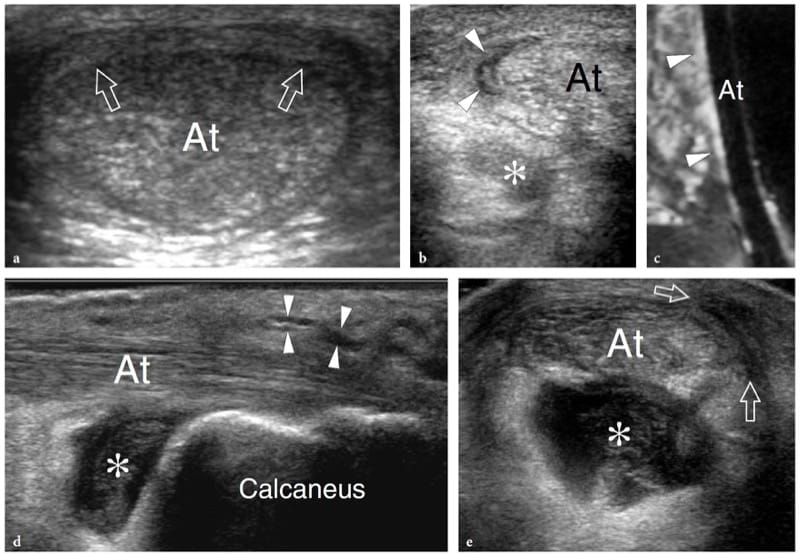
Figure 42. a-e. Peritendinitis and bursitis. Three different cases. a Peritendinitis of the Achilles tendon in a patient with high-grade tendinosis and severe posterior ankle pain. Short-axis 12–5 MHz US image over the middle third of the Achilles tendon shows an abnormal hypoechoic tissue layer (arrows) on the posterior surface of the tendon (At), a finding characteristic of peritendinitis. b,c Isolated Achilles peritendinitis in a 30-year-old long-distance runner with heel pain of recent onset. b Short-axis 17–5 MHz US image over the mid-distal Achilles tendon with c sagittal fat-suppressed T2-weighted MR imaging correlation reveals a crescentic-shaped fluid collection (arrowheads) around the medial aspect of an otherwise normal Achilles tendon (At). Note the small amount of hypoechoic fluid (asterisk) distending the retrocalcanear bursa. d,e Heel bursitis in a 53-year-old female tennis-player who suffered from chronic heel pain. d Long-axis and e short-axis 17–5 MHz US images over the distal Achilles tendon (At) demonstrate discrete hypoechoic distention of the retrocalcanear bursa (asterisk) by fluid and hypertrophied synovium. Some fluid is also seen in the retro-Achilles bursa (arrowheads) and the subcutaneous tissue (arrows) around the Achilles tendon insertion.
27. TENOSYNOVITIS
In tendons with a synovial sheath, inflammation is mostly secondary to repetitive microtrauma, due to overuse or osseous friction, foreign bodies, or infection and arthritis. Acute serous tenosynovitis is diagnosed by identifying an increased amount of fluid within the tendon sheath (Gooding 1988; Stephenson 1990). The fluid typically encircles the tendon forming a “halo” around it: this sign helps to distinguish the tenosynovial nature of the effusion from other paratendinous cystic lesions, such as bursae or ganglion cysts, in which fluid is located eccentrically to the tendon. In subacute or chronic disease, the effusion is often associated with sheath thickening (Martinoli et al. 1999). Careful scanning technique is needed to demonstrate small but significant synovial effusions which, for instance, can be easily unrecognized if excessive pressure by the transducer causes collapse of the sheath.
Depending on its cellular content, the fluid in the synovial sheath may be anechoic or may contain subtle echoes in suspension. The entrapment and chronic conflict of tendons beneath a ligament or a pulley may cause a stenosing tenosynovitis, i.e., de Quervain disease, trigger finger (Fig. 43a,b). The involved tendons are diffusely swollen with textural disarrangement and focal or diffuse thickening of the synovial sheath. Simple synovial effusion is observed in acute cases, whereas chronic cases present with thickening of the retinacula, which usually represents an indication for operative management (Fig. 43c–e). Dynamic US examination with passive assisted movements may demonstrate the entrapment of the synovial sheath at the entrance of the narrowed tunnel (Fig. 43f,g).
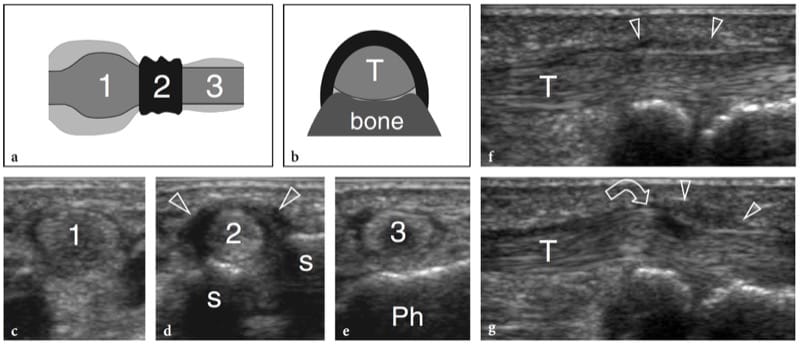
Figure 43. a–g. Stenosing tenosynovitis. a,b Schematic drawings illustrate the pathomechanism leading to conflict of a type 2 tendon under a thickened retinaculum in an osteofi brous tunnel. a Long-axis and b short-axis views over the affected tendon demonstrate increased thickness and narrowing of the retinaculum (black) which constrains the underlying tendon (intermediate gray), increased tendon thickness (1) proximal to the retinaculum with sheath fluid distension (light gray), abrupt narrowing of the tendon size (2) underneath the retinaculum, and mild tendon and sheath abnormalities (3) distal to level of
the retinaculum. c–g Trigger thumb. c–e Short-axis 15–7 MHz US images obtained from c proximal to e distal over the first metacarpophalangeal joint in a 54-year-old woman with chronic painful extension of the thumb corresponding to the levels shown in a. Proximal to the A1 pulley, the flexor pollicis longus tendon shows progressive increase of its cross-sectional area (1); at the level of the sesamoids (s), it sudden decreases in size (2) under the thickened pulley (arrowheads); after exiting the pulley, the tendon returns to a normal size (3) over the proximal phalanx (Ph). f,g Long-axis 15–7 MHz US images of the flexor pollicis longus tendon (T) obtained over the thickened A1 pulley (arrowheads) during f flexion and g extension of the distal phalanx. Dynamic scanning demonstrates the difficult gliding (curved arrow) of the tendon as it passes deep to the thickened pulley during thumb extension.
In infectious tenosynovitis, the effusion tends to be more echogenic and the overlying subcutaneous tissue may appear thickened and hyperechoic due to cellulitis (Brooke Jeffrey et al. 1987; Schechter et al. 1989). However, it must be emphasized that these characteristics are too subtle to allow a definitive diagnosis based on US findings alone. Needle aspiration of fluid, possibly obtained under US guidance, is necessary to confirm the infectious nature of tenosynovitis as well as to identify the causative bacteria and choose the appropriate antibiotic therapy. As an exception to this rule, the diagnosis may be straightforward on US findings when a foreign body is recognized within the synovial sheath (Fig. 44) (Howden 1994). In the setting of infection, color and power Doppler imaging may show increased flow but is unable to reliably differentiate an infected from a noninfected state (Newman and Adler 1998). Furthermore, in some instances there may be no increased blood flow in the sheath, (Craig et al. 2003). In tuberculous tenosynovitis, the tendon sheaths appear markedly thickened as a result of granulomatous changes (Riehl et al. 1997). Color and power Doppler imaging can detect the hyperemic state as increased flow signals within the inflamed sheaths (Breidhal et al. 1998).
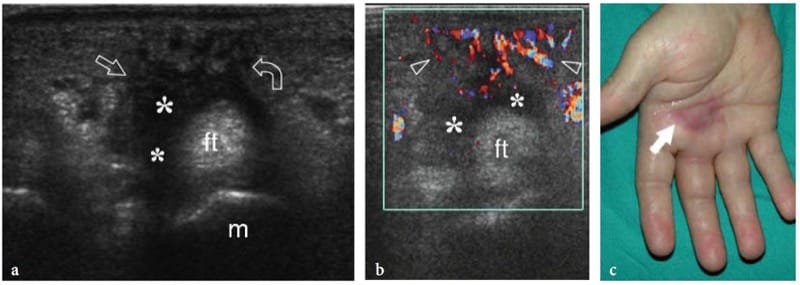
Figure 44. a–c. Infectious tenosynovitis. a Short axis 12-5 MHz gray-scale and b color Doppler US over the right palm in a 35 year old patient who complained of increasing pain and local inflammatory symptoms one week after a minor penetrating trauma demonstrate a distended sheath of the flexor tendons (ft) of the long finger by echogenic effusion and hypechoic changes in the surrounding tissues related to cellulitis (arrows). Note the undefined outer boundaries of the tendon sheath and the intense superficial hyperemia (arrowheads). m, third metacarpal. c Photograph of the patient’s hand reveals reddish skin (arrow) due to intense local inflammation.
In rheumatologic disorders, such as rheumatoid arthritis and psoriatic arthritis, hypoechoic villous projections of the synovium (pannus) can develop inside the effusion and may even fill the synovial space (Fig. 45a-c) (Milosavljevic et al. 2005). Multiple tendons can be simultaneously involved, especially the extensor carpi ulnaris along with other flexor and extensor digitorum tendons at the wrist and the posterior tibial tendon. In persistent synovitis, the biochemical and compressive damage related to the invading pannus and the mechanical stress caused by chafing of the tendon against the bone, as in the case of a dorsally subluxated ulna or Lister tubercle, increases the incidence of tendon ruptures (Swen et al. 2000). The propensity for tendon rupture is considered to be independent of the extent of the tenosynovitis and seems to correlate with aggressive rheumatoid arthritis with high titers of rheumatoid factor and bone erosions in an early stage of the disease (Swen et al. 2000). In these patients with loss of finger function, US can be used to differentiate the functional impairment due to joint disease from tendons tears as well as to detect partial tendon tears that cannot be identified at physical examination (Swen et al. 2000). Probe compression can be helpful to differentiate complex effusion from synovial thickening because fluid may be squeezed away, in contrast to noncompressible synovium. Similarly, Doppler imaging has a value in distinguishing the hypoechoic pannus from the effusion based on the presence or absence of flow signals, as well as in differentiating highly vascular, active pannus from hypovascular fibrous pannus (Fig. 45d) (Newman et al. 1996). Especially in patients refractory to drug treatment, an early diagnosis of tendon involvement with US is essential to both plan and improve the outcome after prophylactic tenosynovectomy (Brumfield et al. 1990). Future possibilities include follow-up of disease progression and quantification of response to therapy (Newman et al. 1996). Because Doppler imaging techniques are limited in their ability to detect slowly flowing blood and small vessels, microbubble-based US contrast seems promising to increase the US sensitivity to detect hyperemic states in tendons. In the tibialis posterior, US and MR imaging have similar accuracy in revealing signs of paratendinopathy, including peritendinous sheath effusion and hyperemia (Premkumar et al. 2002).
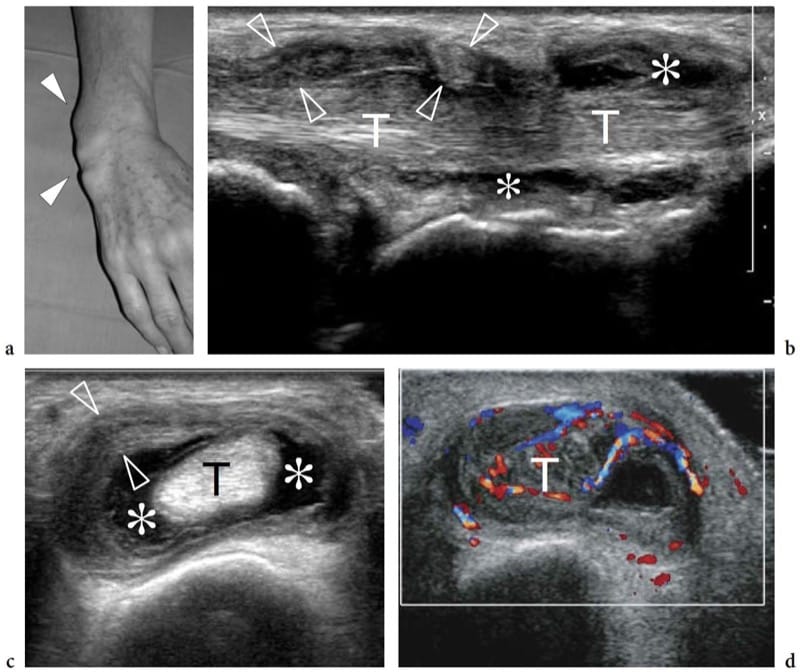
Figure 45. a–d. Hypertrophied tenosynovitis in a 63-year-old woman with long-standing rheumatoid arthritis. a Photograph demonstrates considerable soft-tissue swelling (arrowheads) over the dorsoulnar aspect of the patient’s wrist. b Long-axis and c short-axis 17–5 MHz US images over the ventral aspect of the ulnar wrist reveal marked irregular thickening of the synovial sheath (arrowheads) of the extensor carpi ulnaris tendon (T) with intrasheath fluid (asterisks). d Correlative color Doppler image shows hyperemic synovial walls and intratendinous flow signal, suggestive of active disease. In this particular case, there was concomitant involvement of the distal radioulnar joint and bone erosions on the ulnar head.
28. ENTHESOPATHY
An enthesis is the point of union between bone and a tendon, a ligament, an aponeurosis, or a capsule. Inflammation typically occurs at the enthesis in seronegative spondyloarthropathy and, to a lesser extent, in rheumatoid arthritis and gout, leading to soft-tissue thickening, cortical bone breakage, and new bone proliferation (Gibbon and Wakefield 1999; Balint et al. 2002). Bursitis and synovitis often occur in the surrounding tissues. In spondyloarthropathy, the most common sites of involvement are the knee (superior and inferior poles of the patella, tibial tuberosity), the heel (posterosuperior and posteroinferior poles of the calcaneus), and the ischial tuberosity, leading to local pain and stiffness (Balint et al. 2002). Pain films are normal in early disease, but they can reveal specific radiographic features, such as bony erosion, hyperostosis, fragmentation, and crystal deposition as late manifestation of enthesitis (Barozzi et al. 1998; Gnenc et al. 2005). Even better than radiography, US has proved to be a sensitive means of detecting bone erosions as cortical breakages with a step-down contour defect, and enthesophytes as step-up bony prominences at the end of the normal bony contour (Barozzi et al. 1998; Balint et al. 2002; Kamel et al. 2003; Gnenc et al. 2005). However, the advantages of US rely on its ability to depict associated soft-tissue changes, including periosseous edema, focal tendon thickening, abnormal tendon echotexture with calcifications, and bursal fluid distension at the site of tenderness (Lehtinen et al. 1994; Barozzi et al. 1998; Kamel et al. 2003).
29. TUMORS AND TUMOR-LIKE CONDITIONS
Primary tumors (i.e., fibroma of the tendon sheath, clear cell sarcoma) arising from the tendon and its sheath are exceptional (Gandolfo et al. 2000; Fox et al. 2003). On the contrary, non-neoplastic space-occupying lesions, such as ganglion cysts and the localized giant cell tumor of the tendon sheath, are much more common. Although most of these lesions present as slowly growing painless soft-tissue swellings in the extremities, their mass effect may lead to compression of adjacent structures and transient arrest of tendon gliding in a finger, especially if the mass develops in proximity to retinacula or within an osteofibrous tunnel (Bertolotto et al. 1996).
30. INTRATENDINOUS AND TENDON SHEATH GANGLIA
Ganglion cysts usually arise from para-articular tissues but those originating within a tendon are rare (Bianchi et al. 1993). The etiology of intratendinous ganglia is not completely understood: recurrent injury to the tendon with subsequent cystic degeneration seems to be a possible cause (Kannus and Jozsa, 1991). The clinical relevance of intratendinous ganglia is based on the fact that they weaken the structure of tendons and predispose them to rupture. A palpable mass that moves with excursion of the affected tendon is usually seen at physical examination and dynamic US is an ideal means to define the intratendinous location of the cyst. US demonstrates intratendinous ganglia as fusiform or lobulated cysts contained in an intact but expanded tendon (Fig. 46c–e). Typically, they are filled with gelatinous material and exhibit a well-defined posterior acoustic enhancement, although internal low-level echoes may be encountered in longstanding or inflamed lesions. At certain sites, such as the ankle, intratendinous ganglia must be distinguished from longitudinal fissurations reflecting tendon tears. In these cases, CT- and MR-tenography may help the diagnosis by showing contrast material within the tendon substance in partial tears, whereas intratendinous ganglia remain unenhanced (Costa et al. 2003). Intratendinous ganglia should be distinguished from the more common tendon sheath ganglia, which are mobile stiff masses arising from the visceral layer of the tendon sheath (Fig. 47). These latter ganglia expand within the tenosynovial space, whereas the tendon substance is unaffected. US-guided needle aspiration of the fluid content of ganglion cysts has been reported, but recurrences are frequent.
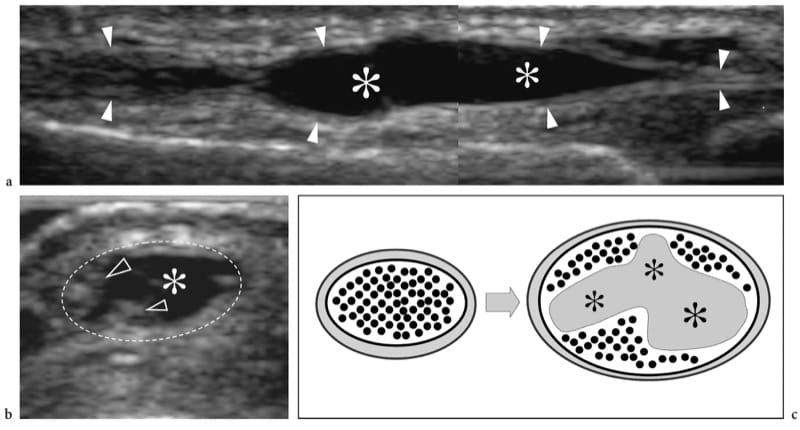
Figure 46. a–c. Intratendinous ganglion. a Long-axis and b short-axis 15–7 MHz US images over a soft-tissue mobile lump on the dorsal aspect of the thumb show a fusiform ganglion cyst (asterisks) developing within the substance of the extensor pollicis longus tendon (arrowheads). On the short-axis image, the dashed line indicates the outer tendon boundaries. Note that some tendinous fibers (arrowheads) are displaced by the expanding cyst (asterisk). c Schematic drawing illustrates how the ganglion cyst (asterisks) expands within the tendon substance.
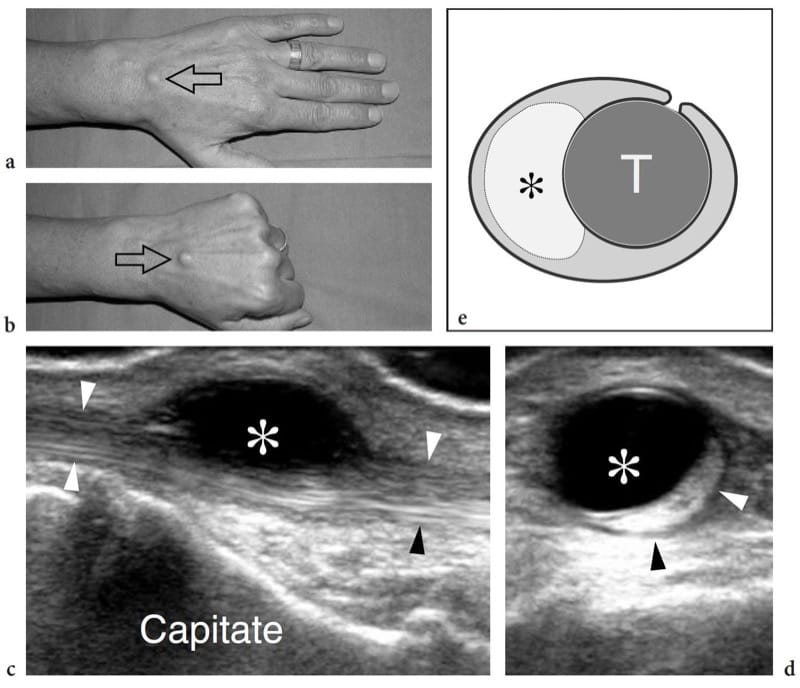
Figure 47. a–e. Tendon sheath ganglion. a,b Photographs of the dorsal aspect of the hand demonstrates a small stiff lump (arrow) that moves back and forward along the axis of the middle finger during a finger extension and b fist clenching. c Long-axis and d short-axis 17–5 MHz US images show a ganglion cyst (asterisk) adherent to the extensor tendon (arrowheads) of the middle finger. As shown in d, the cyst develops within the sheath and causes compression on the adjacent tendon. e Schematic drawing illustrates the cyst (asterisk) as it arises from the visceral layer of the tendon sheath (T) and expands within the synovial space.
31. GIANT CELL TUMOR OF THE TENDON SHEATH
The giant cell tumor of tendon sheath preferentially involves the first three fingers and first two toes. It is a slowly growing benign condition which preferentially arises at the synovium of tendon sheaths and can cause bone erosions. It presents as a solid mass containing multinucleated cells and hemosiderin deposits. The lesion is locally aggressive, requires surgical excision, and the postoperative recurrence rate is high. Because the giant cell tumor arises from the tendon sheath, it is in close contact with a tendon to a variable extent. Most often, the extent of the contact of the mass with the tendon is wide and, in the fingers, the circumferential involvement of the tumor around the phalanx is extensive (Kitagawa et al. 2003). US demonstrates the giant cell tumor of the tendon sheath as a well-defined solid homogeneous hypoechoic mass encircling a tendon (Fig. 48) (Horcajadas et al. 2003; Middleton et al. 2004). Despite the close contact, the mass does not move with the tendon when the tendon glides: this is related to the fact that the lesion arises from the sheath and not from the tendon itself. MR imaging features of the giant cell tumor reflect the underlying histologic composition and its hemosiderin content (low T2 signal) (Fig. 48d–f) (De Beuckeleer et al. 1997; Kitagawa et al. 2003).
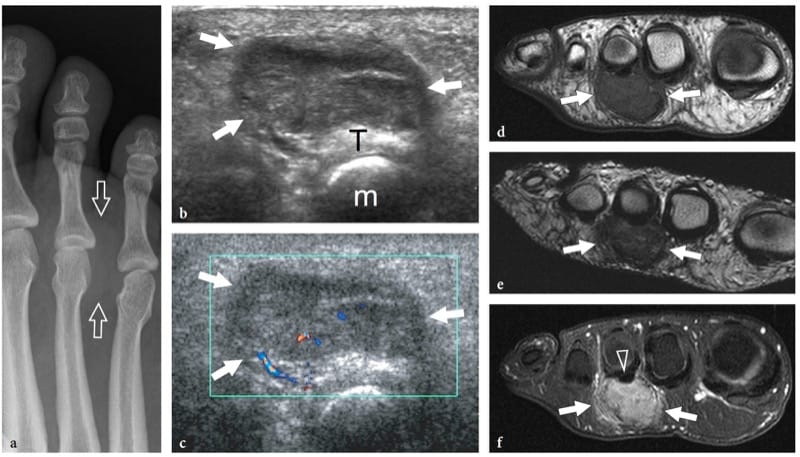
Figure 48. a–f. Giant cell tumor of tendon sheath. a Radiograph of the forefoot in a 56-year-old woman with a painful palpable plantar space-occupying lesion shows a soft-tissue mass effect (arrows) at the third intermetatarsal space. b,c Short-axis b gray-scale and c color Doppler 12–5 MHz US images over the plantar aspect of the foot show a well-defined solid hypoechoic mass (arrows) which grows closely to the flexor tendon (T) of the third toe. The tumor reveals some detectable blood flow located peripherally and centrally (m, metatarsal). d–f Correlative axial d T1-weighted, e T2-weighted, and f gadolinium-enhanced fat-suppressed T1-weighted MR images demonstrate the tumor (arrows) immediately adjacent to the third flexor tendon (arrowhead). The mass exhibits low signal intensity on the T2-weighted MR image due to hemosiderin deposits and discrete uptake of gadolinium on the postcontrast image, which are characteristic fi ndings of a giant cell tumor. No bone erosions are observed in this particular case.
-
July 12, 2025Ultrasound in Interventional Pain Medicine Comprehensive Workshop (Plus C...
-
July 19, 2025Ultrasound-Guided Regional Anesthesia Boutique Workshop
-
August 8, 2025Anesthesia Review Conference

